Dataset Description
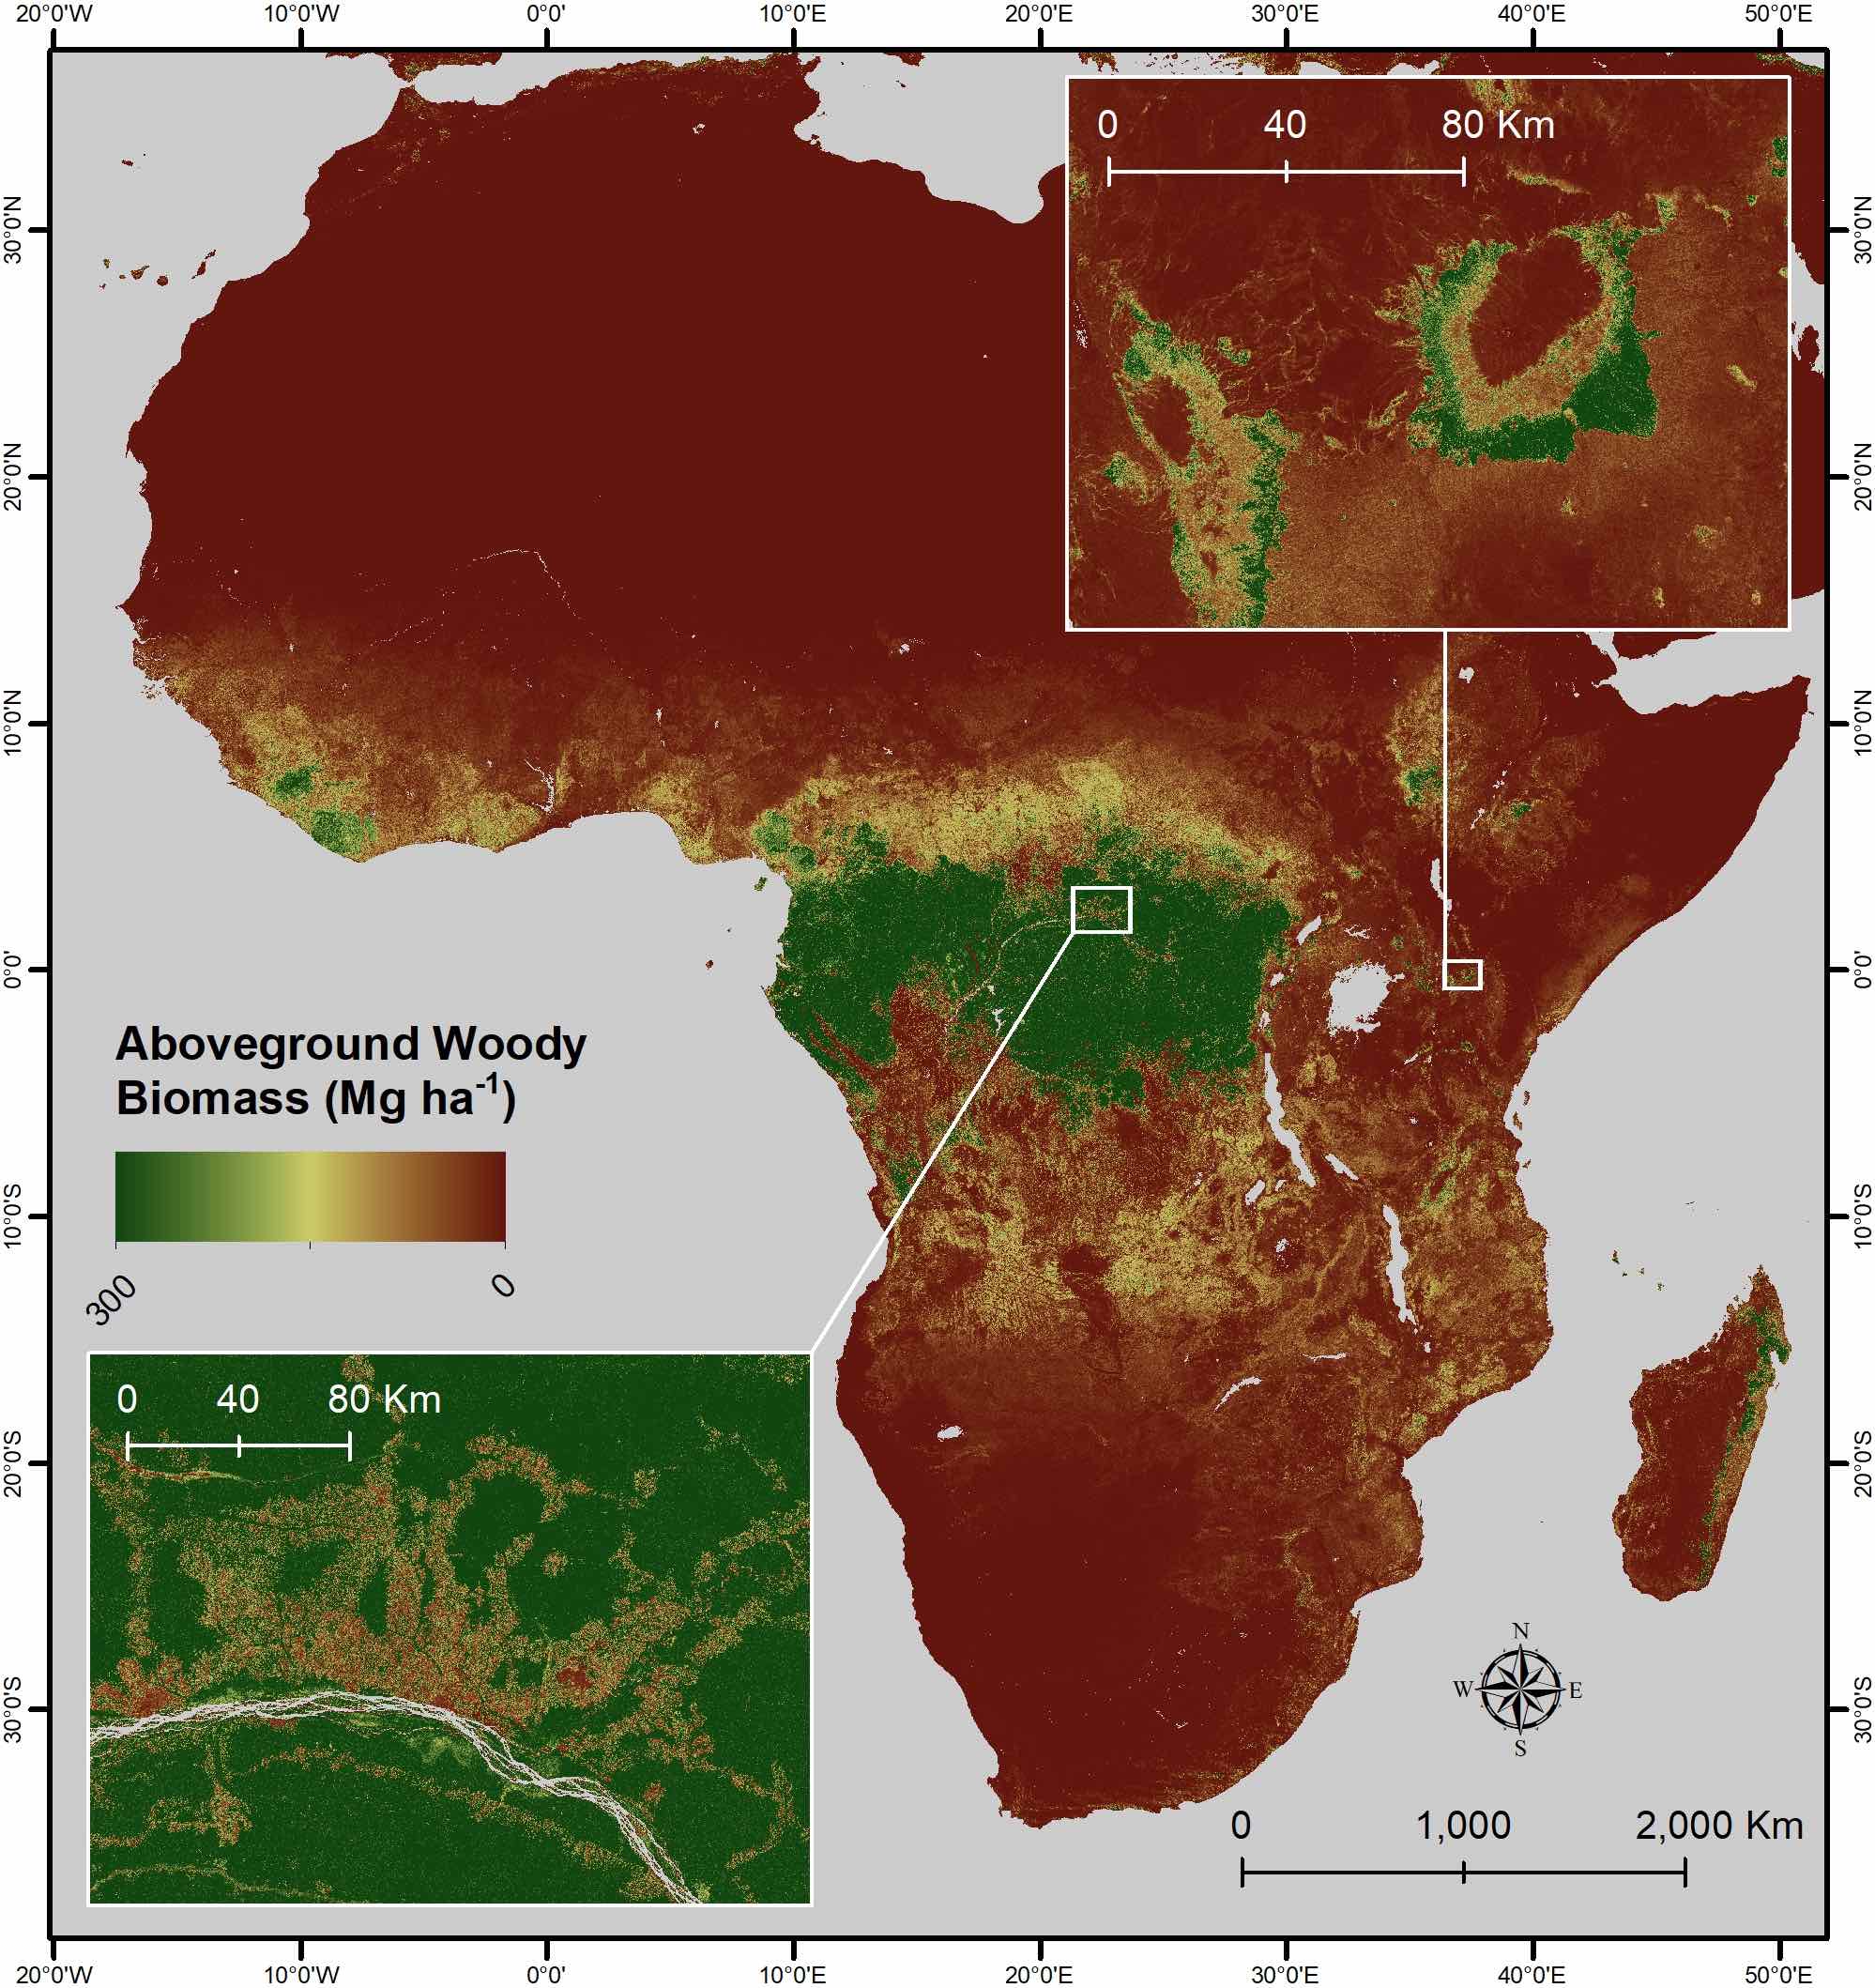
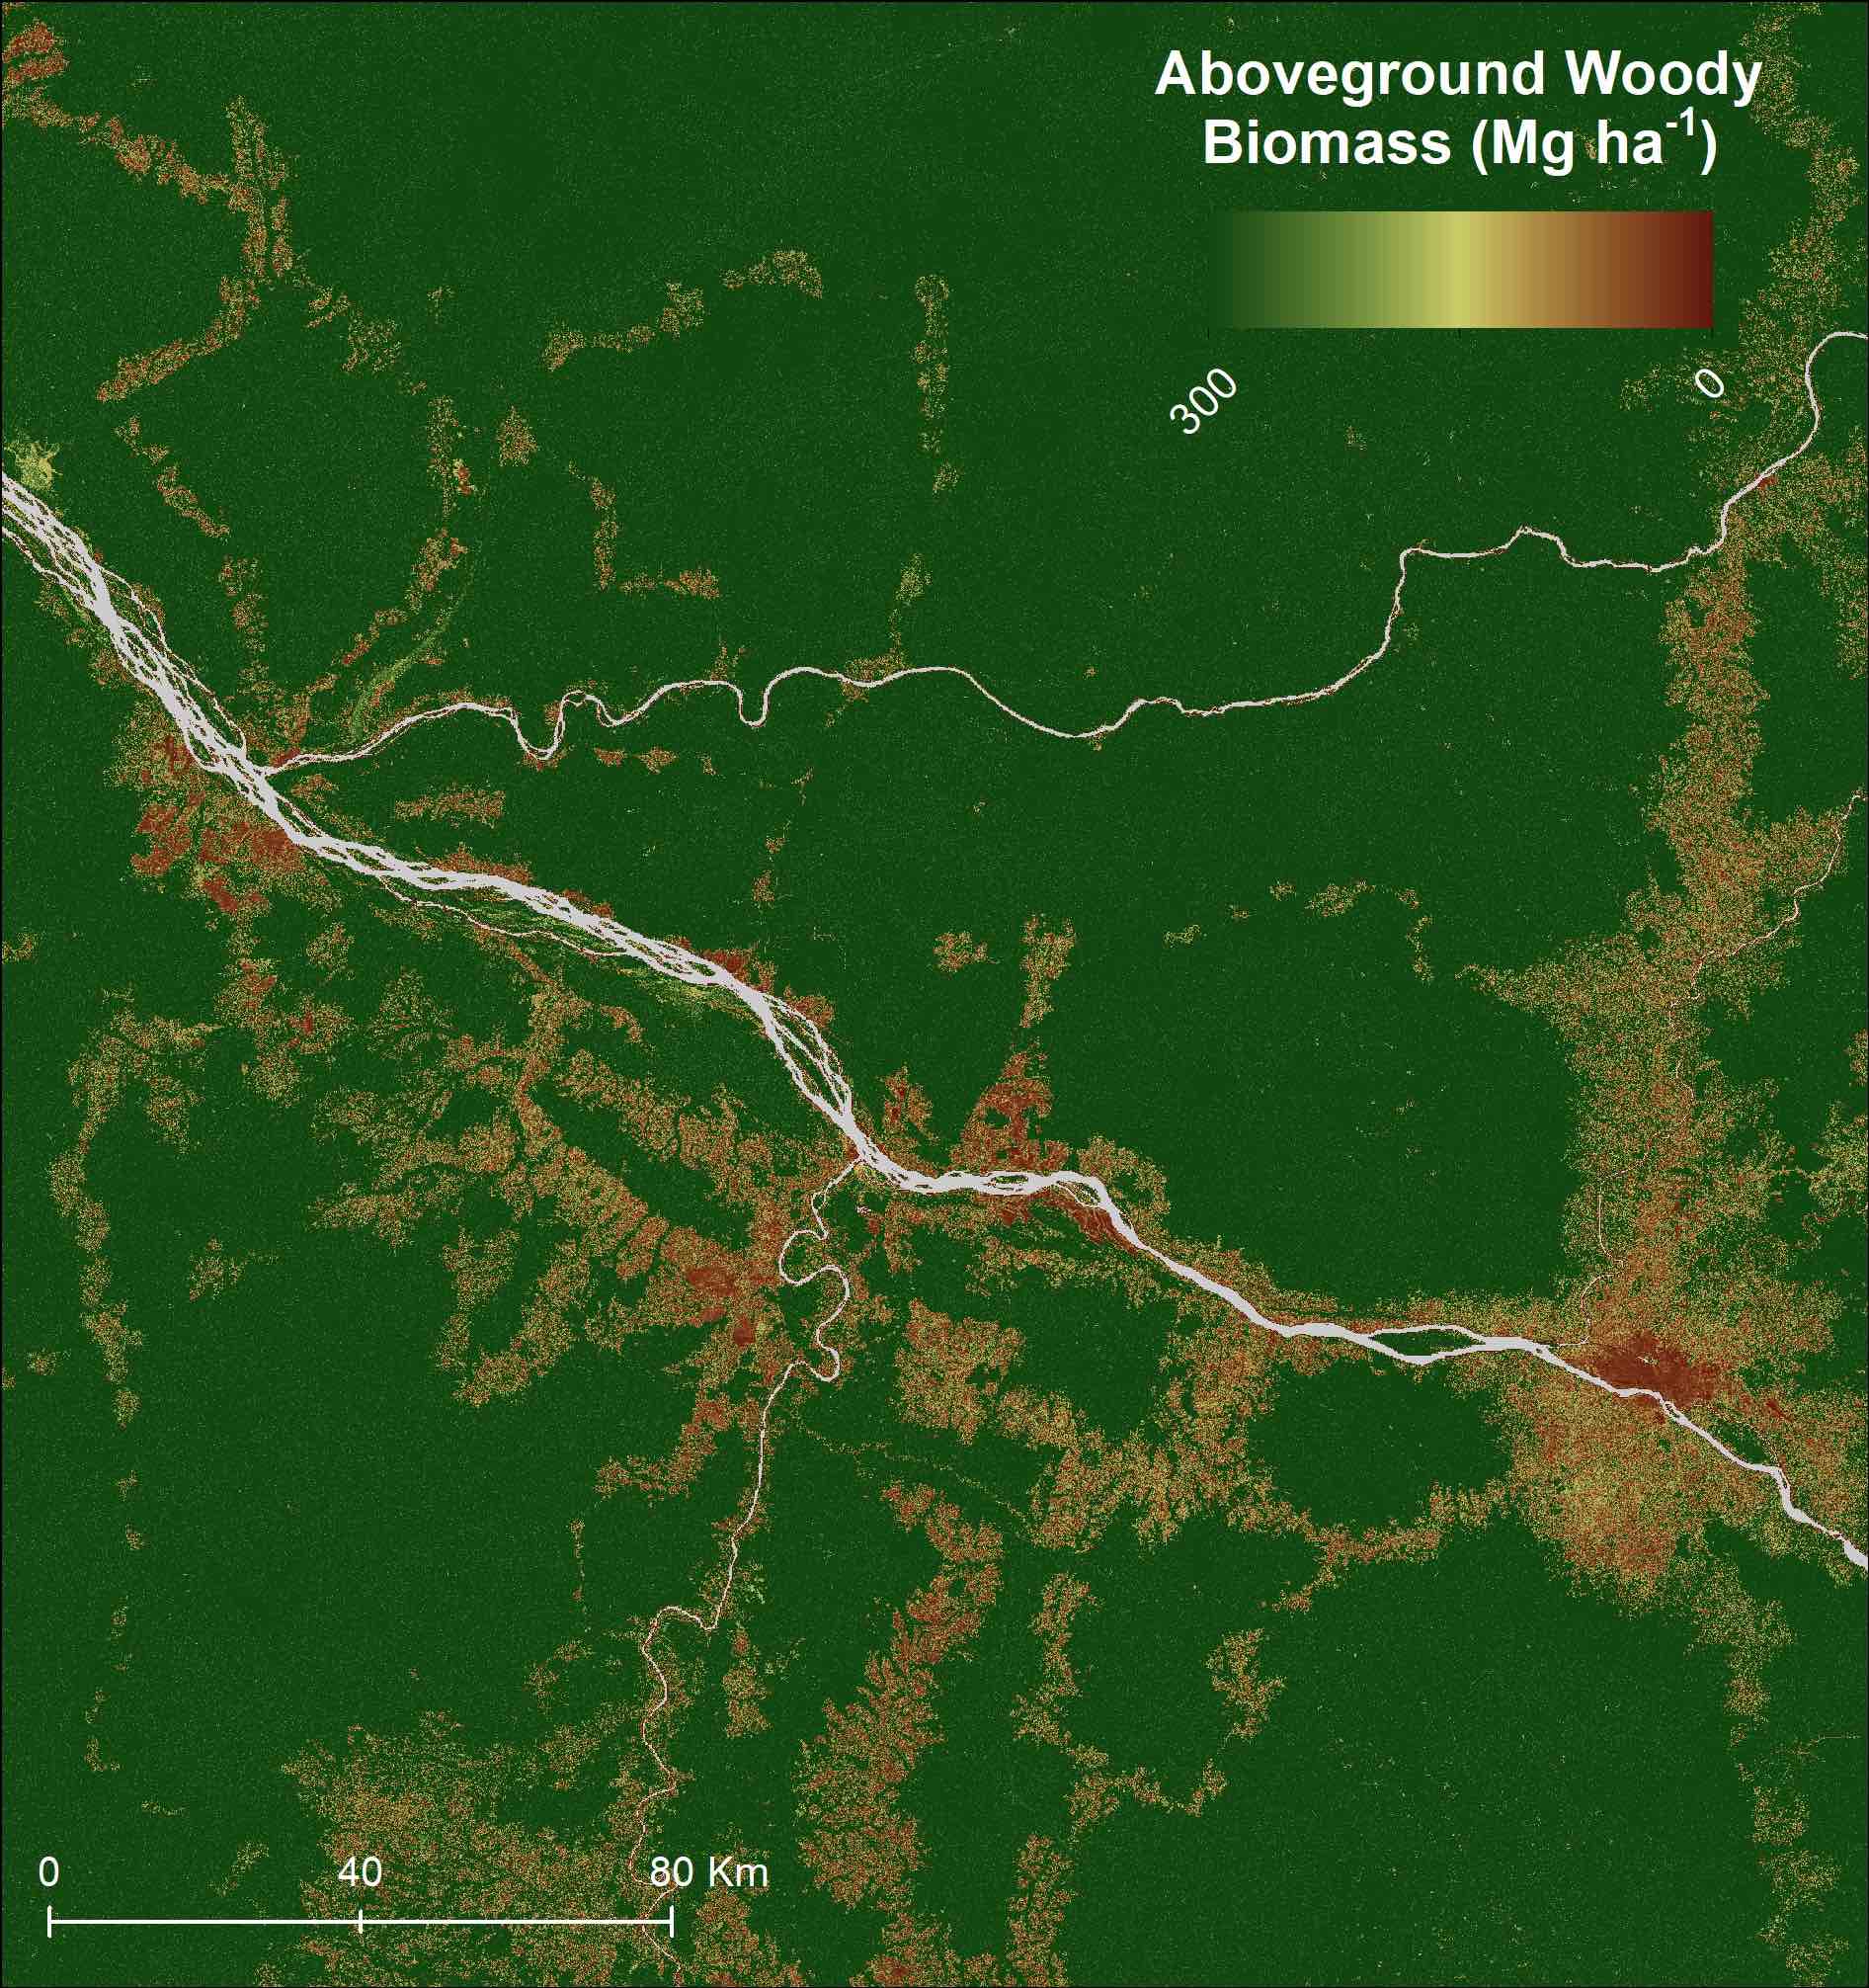
The NCEO Africa Aboveground Woody Biomass (AGB) map for the year 2020 at 100 m spatial resolution was developed using a combination of LiDAR, Synthetic Aperture Radar (SAR) and optical based data. This product was developed by the UK’s
National Centre for Earth Observation (NCEO) through the Carbon Cycle and Official Development Assistance (ODA) programmes.
Usage
The dataset consists of two files: i) Aboveground woody biomass raster, and ii) Uncertainty characterization raster. Both with a spatial resolution of 100 m. Aboveground woody biomass (AGB) is expressed as dry matter in Mg ha
-1. Users should keep in mind that the map is a continental-scale dataset, which has been generated combining different types of data with a single method for the whole study area. Therefore, accuracy may vary for different regions and vegetation types.
Methodology
The model is based on an algorithm initially developed by Pedro Rodrigues Veiga and implemented in Google Earth Engine (Gorelick et al, 2018). A Canopy Height Model (CHM) map for Africa was first generated by combining clusters of Global Ecosystem Dynamics Investigation (GEDI) footprints canopy height measurements (Dubayah et al 2020) with L-band SAR (JAXA ALOS-2 PALSAR-2) (Shimada et al, 2014) and Percent Tree Cover (PTC). Version 1.0 of the model used PTC from Landsat (Hansen et al, 2013), while version 2.0 used Copernicus Tree Cover Fraction from PROBA-V (Buchhorn et al, 2020). Canopy height was then calculated by means of a Random Forests (RF) algorithm within a spatial k-fold calibration / validation framework. Clusters of GEDI footprints were used as reference data for the CHM estimation by grouping 4 consecutive footprints along track. Then, an empirical model relating CHM to AGB, and developed using several airborne LiDAR AGB products, was used to estimate AGB. Tree cover data were also used to constrain AGB estimations to pixels with tree cover higher than 0% (discarding desserts, water bodies, etc.).
Uncertainty and Accuracy
We first estimated the ε
CHM which is the standard deviation (SD) from our CHM retrieval based on RF and calculated as follows: ε
CHM = (ε
2measurement + ε
2temporal_difference + ε
2sampling + ε
2prediction)
1/2, where ε
measurement is the SD arising from the measurement error of the GEDI footprint, ε
temporal_difference is the SD from the use of GEDI footprints and EO imagery acquired at different time periods, and ε
sampling is the SD originating from the variability of CHM within the pixel. The ε
prediction corresponds to our model SD originated from the spatial k-fold framework. The ε
prediction also accounts for errors that arise if the sampling sites are not truly representative of the distribution of CHM in the region. The total SD from our AGB estimation at pixel level ε
AGB is composed of different sources of error, which are assumed to be random and independent. These are propagated using the following equation: ε
AGB = (ε
2CHM + ε
2LiDAR + ε
2model)
1/2, where ε
LiDAR is the SD from AGB LiDAR maps used as reference and includes field measurements, tree allometries and model errors. The ε
model is the error of AGB = f(CHM) empirical model.
The AGB product is validated against a large dataset of in situ AGB estimations (i.e., forest inventory plots), and AGB estimated from airborne LiDAR data. Initial independent validation using ground measurements and airborne LiDAR shows RMSE = 48.5 Mg ha
-1 and R
2 = 0.83.
Dataset Sustainment
This product is part of a larger dataset that covers the years 2007, 2008, 2009, 2010, 2015, 2016, 2017, 2018, 2019 and 2020. Further updates are planned but it will depend on funding and data availability.
Technical Characteristics
Spatial resolution: ~100m
Geographical coverage: Continental (Africa)
Temporal coverage: 2007-2010; 2015-2020
Update frequency: Annual
Format: GeoTIFF
Data Policy: Creative Commons Attribution 4.0 International (CC-BY-4.0)
Associated Guidance or User Manual
Product manual available here.
Validation report not yet available, but it will be available here.
Dataset link available here.
Points of contact for queries
Dr Nezha Acil
Research Associate
National Centre for Earth Observation
University of Leicester, Space Park Leicester, UK
Email: n.acil@leicester.ac.uk