Dataset Description
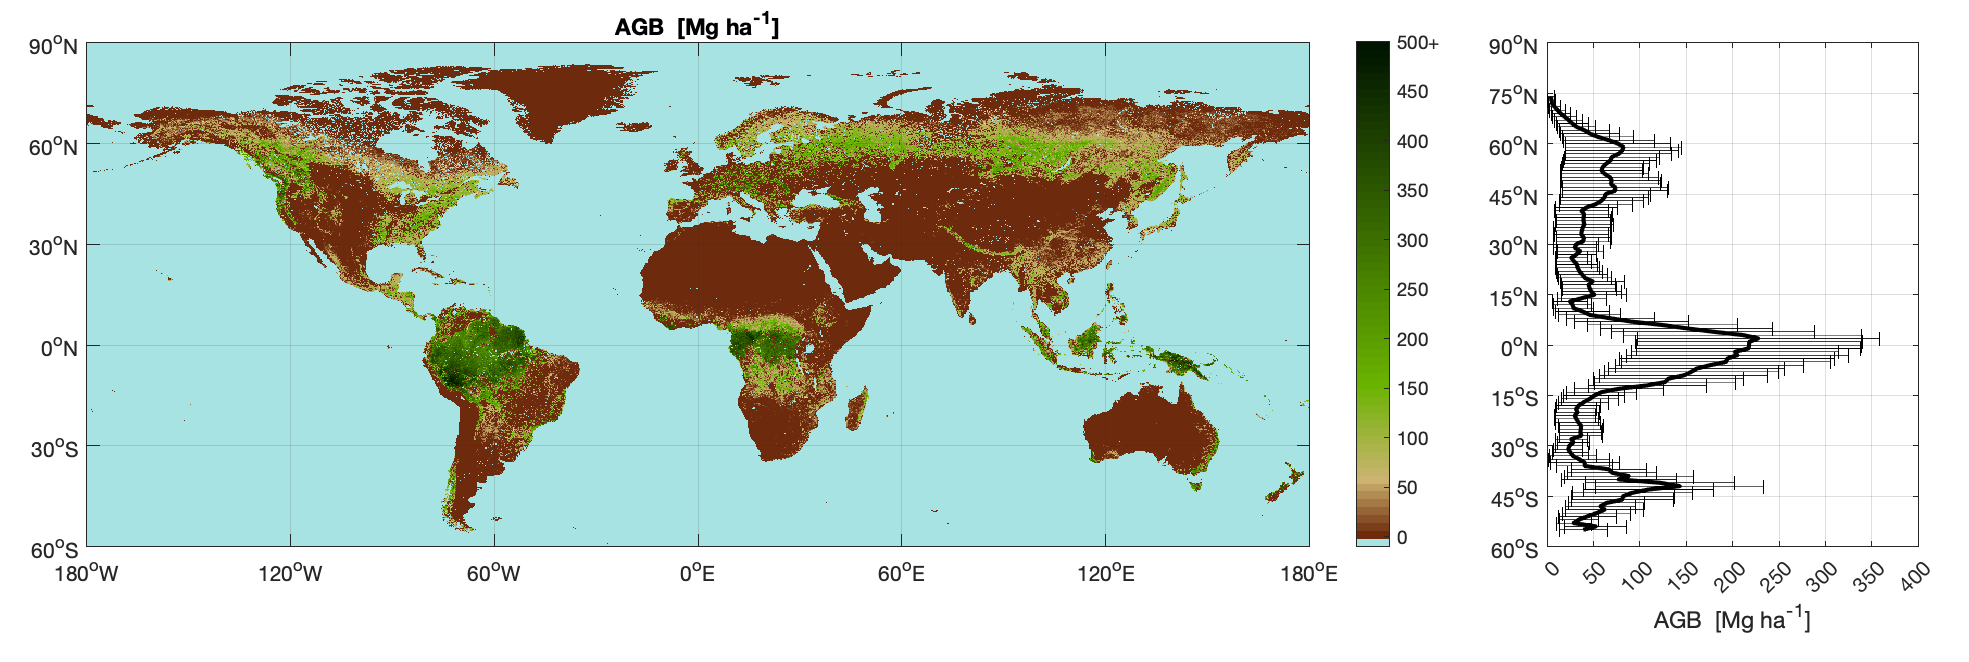
The CCI BIOMASS project delivers spatially explicit estimates of AGB for five epochs and related standard deviations (SDs) as separate map products, plus AGB change on an annual and decadal basis. The AGB product consists of global datasets with estimates of AGB (unit: tons/ha = Mg/ha). AGB is defined as the mass, expressed as oven-dry weight of the woody parts (stem, bark, branches and twigs) of all living trees excluding stump and roots. The AGB SD product is a separate data layer providing per-pixel SD of the AGB estimates in Mg/ha.
The data products currently provided by the project (year 4, Version 4.0) consist of five maps of AGB and AGB SD based on Earth Observation data acquired in 2010, 2017, 2018, 2019 and 2020, respectively. The spatial resolution of the map products is 100 m. AGB change is expressed as the difference between AGB maps for either two consecutive years (e.g. 2020-2019) or for a decade (2020-2010), together with an estimate of their SD and a quality flag map, which details the reliability of the AGB change estimate.
Usage
As a result of our investigation of the three AGB datasets and related changes, users are kindly invited to note the following comments:
- The AGB and AGB change maps are not masked for forest. Users wishing to derive statistics for forest land are advised to apply an own forest/non-forest dataset to the CCI BIOMASS data products.
- A pixel with a value equal to 0 means that the AGB is equal to 0 Mg/ha.
- The AGB and AGB change values are representative of the pixel area, i.e., they do not account for partial or total forest cover within the area of the pixel. The biomass stock in a pixel is obtained from the AGB value multiplied by the area of the pixel (NOTE: the area of the pixel changes with latitude).
- AGB refers to the aboveground LIVE dry biomass. However, given that AGB is derived from radar backscatter observations, which are sensitive to wood density, it is likely that values larger than 0 Mg ha-1 occur in correspondence of dead standing wood.
- Shrublands/grasslands are in principle not accounted for. All AGB estimates were obtained with a retrieval model tailored to relate the radar backscatter to the biomass of woody vegetation.
- Biomass of understory and lianas is not accounted for because it is assumed that the remote sensing data used to estimate biomass does not contain sufficient signal scattered from layers below the top canopy.
- Use of the AGB estimates of individual full resolution pixels should be avoided.
- The maps have a global scope and may, therefore, be biased at regional level. Users intending to adopt the CCI BIOMASS data product for national or sub-national studies are advised to check the quality of the CCI product by comparing with local data (e.g., from own field survey, National Forest Inventory, airborne datasets etc.).
- The CCI BIOMASS datasets have not been cross-checked with other CCI datasets.
- The AGB in each annual map corresponds to an average value for the corresponding year. Consequently, the AGB value in correspondence of areas that have been affected by changes within a given year, may not be representative of the AGB either before or after the change.
- The annual maps for 2017, 2018, 2019 and 2020 are equally reliable and supersede any previous release.
- The 2010 dataset is an improved version of older releases and of the GlobBiomass AGB dataset (http://globbiomass.org), which is superseded.
- The 2010 dataset may present AGB > 0 in contrast to AGB = 0 in more recent years in correspondence of non-forest areas. This is due to the lower quality of the EO data used to estimate AGB in 2010. Users are advised to mask out non-forest areas to avoid incorrect interpretation of temporal trends.
- Fluctuations of the AGB values from one year to the next between 2017 and 2020 may occur in correspondence of mixed landscapes, cropland and arid land due to the inter-annual variability of the number of radar observations.
- Trends in the time series of AGB maps have not been analyzed and may therefore need to be critically investigated, in particular when comparing 2010 with more recent years due to the different set of EO observations.
AGB change maps
- AGB change maps are not provided per se. Users interested in an AGB change map between two years need to download the AGB maps for the two years of interest and compute the difference.
- For annual intervals and the decadal intervals 2010 vs. 2020, the CCI Biomass CRDP provides the standard deviation of the change value and a quality flag to interpret the reliability of the change value. For other combinations of years, please contact the data producer via email (santoro@gamma-rs.ch).
- AGB change maps should be interpreted carefully. It is strongly advised to use the quality flag layer to understand the reliability of the AGB change values. AGB change values in correspondence of pixels labelled as “improbable change” may be unrealistic. AGB change values in correspondence of pixels labelled as “gain” or “loss” are realistic although the standard deviation layer of the AGB change map should be accounted for as well.
- Be extremely cautious when using the CCI BIOMASS maps to assess AGB changes. We strongly advise to validate changes before further analysis of the data.
Methodology
Requirements on global coverage during each of the five epochs, open access to the data and sensitivity of the observations to forest structural parameters restricted the useful pool of remote sensing observations to images acquired by SAR C-band (Envisat ASAR for 2010 and Sentinel-1 for 2017-2020) and L-band (ALOS-1 PALSAR-1 for 2010 and ALOS-2 PALSAR-2 for 2017-2020). Initially, separate algorithms (which share the same theoretical basis) were applied to the C-band and L-band datasets. With each algorithm, referred to as BIOMASAR, a global map of AGB was obtained. The BIOMASAR algorithm inverts a semi-empirical model relating the forest backscatter to canopy density and canopy height; these are replaced by two allometries relating canopy density to height (based on spaceborne LiDAR measurements) and canopy height to AGB (based on spaceborne LiDAR height metrics and global statistics of AGB produced by National Forest Inventories). The model contains three parameters that are unknown a priori, and which correspond to specific backscatter components (ground, canopy) and backscattering properties of the forest. In order to estimate them, auxiliary datasets describing canopy density, microwave transmissivity, maximum biomass etc. are used. A detailed description of these data layers is available in the ATBD of the CCI BIOMASS project. Note that the model training phase does not require in situ observations, such as AGB plot data.
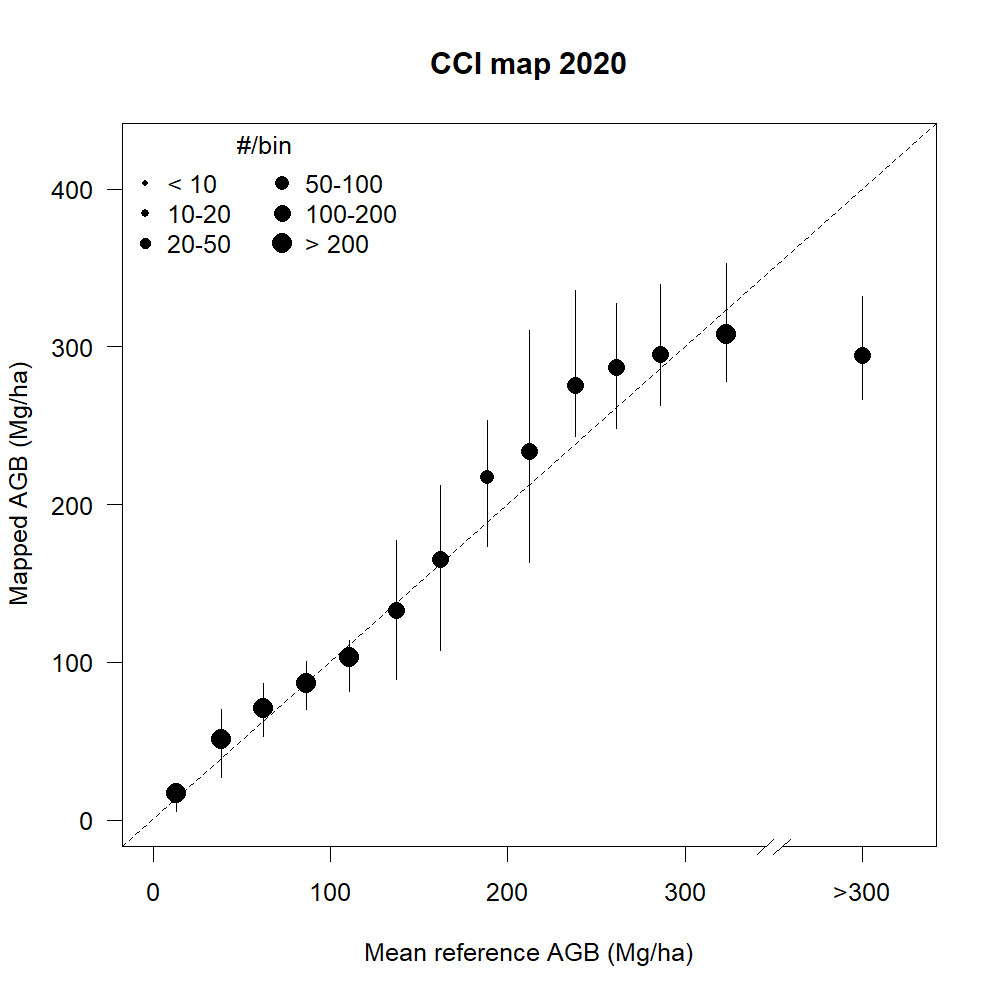 Validation results at 0.1° in different AGB bins. The size of bins is based on the number of plots inside the bin. The error bars indicate the 25th and 75th quantiles of the map value.
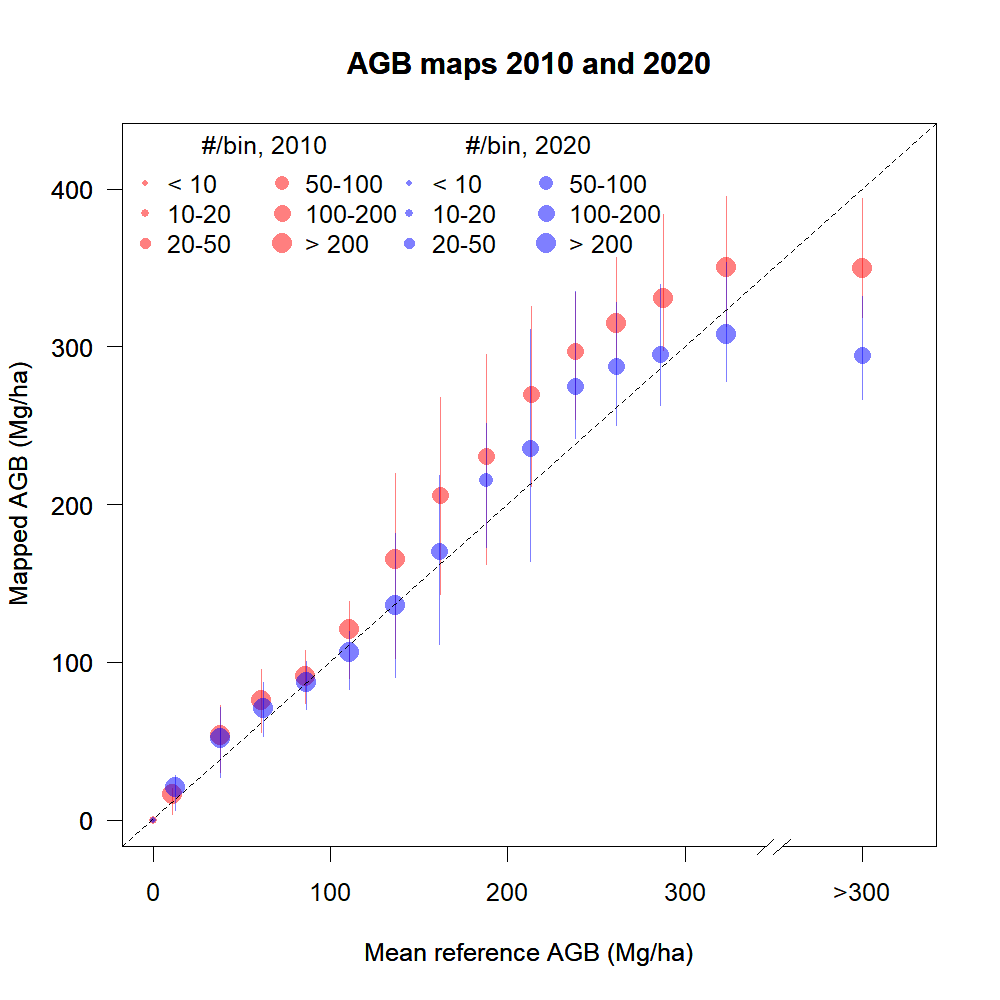
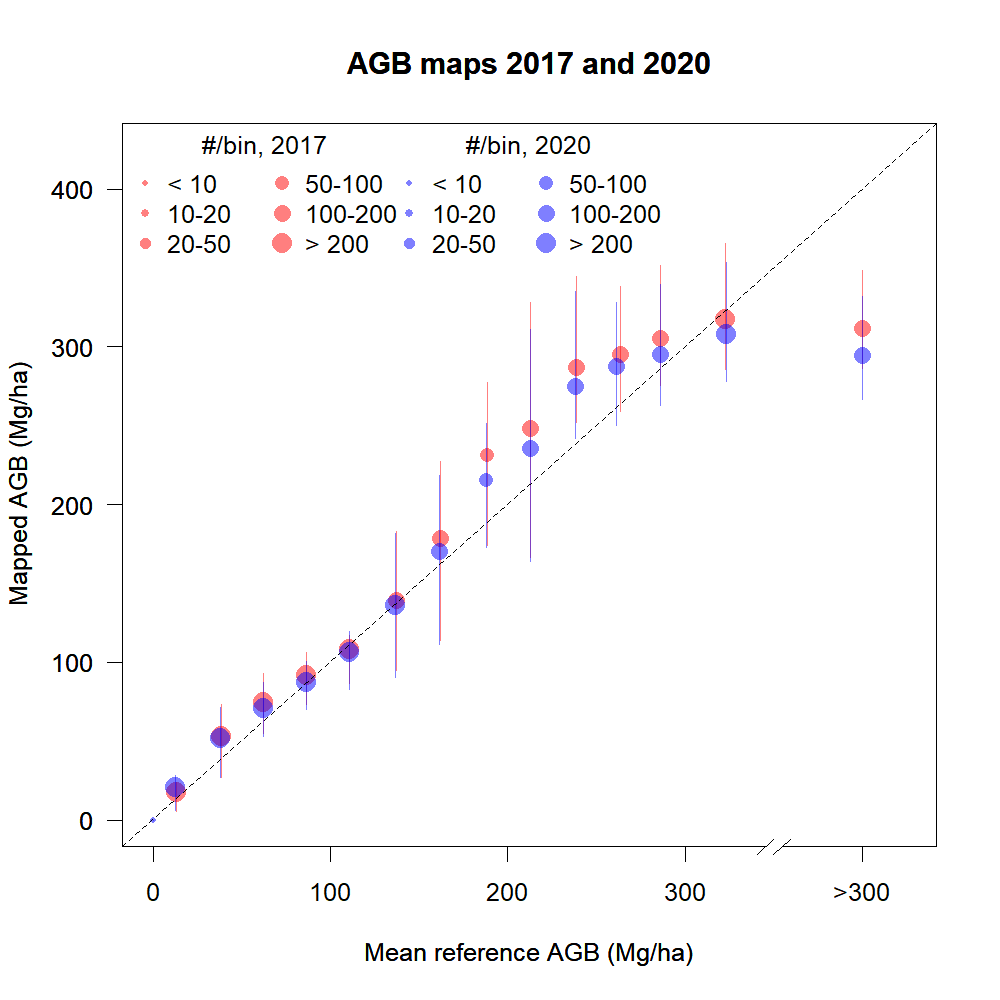
 Validation results at 0.1° in different AGB bins. The size of bins is based on the number of plots inside the bin. The error bars indicate the 25th and 75th quantiles of the map value.
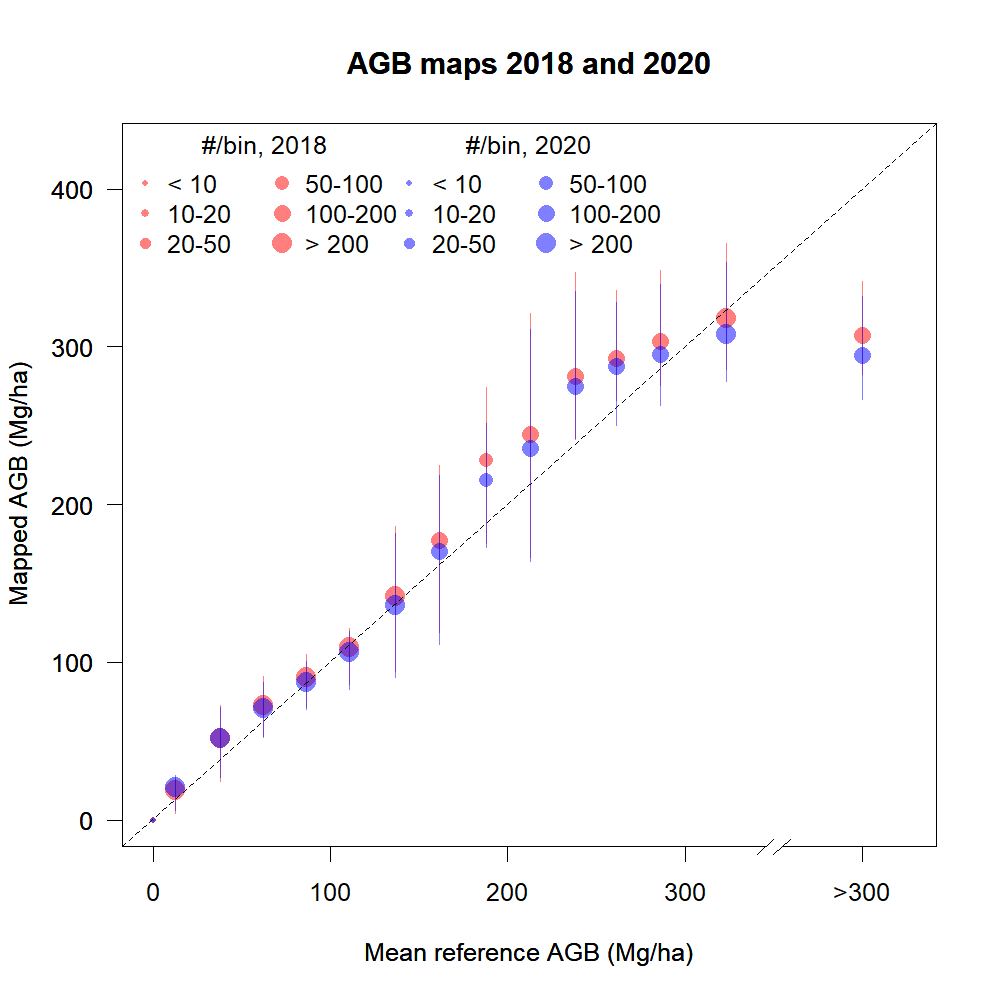
Uncertainty and Accuracy
Validation of the BiomassCCI 2020 map used a dedicated tool (plot2map) that allowed comparison with an extensive dataset of ground-based tree size measurements collected from small (averaging 0.15 ha; n > 70,549) and medium (0.9 - 3 ha; n > 462) to large-sized (> 6 ha; n > 20) research plots (Tiers 1-3 respectively), with adjustments made for temporal discrepancies and partial forest fractions. Comparison against Tier 1 and Tier 2 plots indicated that globally, the CCI Biomass map at their original 1 ha resolution tended to slightly over-predict up to 300 Mg ha-1 and under-predict beyond that. These differences were attributed in part to within-pixel sampling error that occurred because the AGB of single small plots may significantly differ from the population mean in the pixel. Spatial aggregation of plot and map data to 0.1° cells (a level of aggregation suitable for most climate modellers) considerably improved the agreement. In general, between 50 Mg ha-1 and 400 Mg ha-1, mean differences between the mapped and reference AGB were found to be well within 20% at the 0.1° cell level. The validation at 0.1° of the BiomassCCI 2020 and its comparison with the validation from previous CCI maps are shown below. Validation of the 2010, 2017 and 2018 products can be found in the project PVIR.
Dataset Sustainment
Annual products will continue to be released (2019, 2021, 2022) plus an investigation into the feasibility of products for past years (2005/7 and 2015/16). Change maps have been produced for 2010-18 and 2017-18, which will continue to be developed and improved.
Technical Characteristics
Spatial resolution: ~100 m at the Equator
Geographical coverage: Global
Temporal coverage: 2010, 2017, 2018, 2020
Update frequency: Annual
Format: GeoTIFF
Data Policy: Creative Commons Attribution 4.0 International (CC-BY-4.0)
Associated Guidance or User Manual
Product manual not yet available (October 2021), but it will be available from:https://climate.esa.int/en/projects/biomass/
Validation report not yet available (October 2021), but it will be available from:https://climate.esa.int/en/projects/biomass/
2010, 2017 & 2018 Dataset link available from (2020 not yet available; October 2021):
https://climate.esa.int/en/odp/#/project/biomass
Points of contact for queries
Maurizio Santoro
GAMMA RS
Switzerland
Email: santoro@gamma-rs.ch