Dataset Description
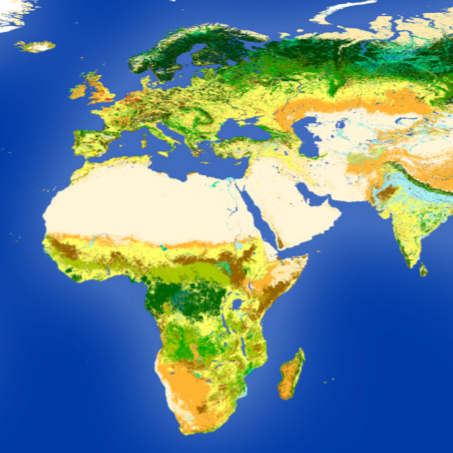
The European Space Agency and Copernicus Climate Change have generated global Land Cover (LC) maps from 1992 to 2022 at 0.002778° (approximately 300 m) from Earth Observation (EO) multi-mission entire archives at 300 m and 1 km. The map legend includes 22 LC classes precisely defined using the Land Cover Classification System (LCCS) developed by the United Nations (UN) Food and Agriculture Organization (FAO), further detailed with 15 regional land cover classes where available. Methodologically decoupling the LC classification and LC Change (LCC) detection ensures temporal and spatial consistency between successive maps. The per-pixel trajectory-based change detection method allowed capturing 15 major LC transitions and up to 7 LCC per pixel in 31 years. Four quality flags, among which the number of LCC detected over the entire period, are delivered along with the maps. A new land cover map is produced annually 9 months after the beginning of the year and validated within a maximum of 3 months after release. A user tool was designed to convert the LCCS nomenclature to Plant Functional Types distributions used in various climate models.
Usage
Thanks to the long-term dataset consistency, the annual updates and the high level of thematic details based on observational data at the global scale, the CCI LC map series served as input for various applications ranging from the impact of the LCC on climate, long-term historical reconstructions for climate modelling to LC and biodiversity accounting, forest and desertification monitoring in the domains of scientific research, policy making and in the business sector.
Specifically, the CCI LC map series were used:
- by the Organisation for Economic Co-operation and Development (OECD) to develop new headline green growth indicators that facilitate the monitoring of global natural assets
- as a source of information to prepare a Land Cover Change (LCC) dataset organized by the LC classification of the SEEA Central Framework (CF). Ultimately, the System of Environmental-Economic Accounting (SEEA) LCC derived data will be published in Food and Agriculture Organization (FAO) STAT in a new domain
- for reporting on the Sustainable Development Goal 15.3 on land degradation neutrality within the United Nations Convention to Combat Desertification (UNCCD)
- in the context of the Coupled Model Intercomparison Project 6 (CMIP6) experiment, the Laboratoire des Sciences du Climat et de l'Environnement (LSCE) has combined CCI LC maps with the land-use harmonization (LUHv2) database to generate a time series of global ORCHIDEE PFT maps from 1850 to 2015.
- in the implementation in the HYDE database and IMAGE integrated assessment modelling of the PBL Netherlands Environmental Assessment Agency
Users are invited to take note of the extensive validation carried out on the global land cover maps and reported in the
Product Quality Assessment Report.
Methodology
The entire Medium Resolution Imaging Spectrometer (MERIS) Full and Reduced Resolution archive 2003–2012 was first classified into a unique 10-year baseline LC map. The baseline was then back- and up-dated using land cover change detected from multi-sensor time series (i) Advanced Very-High-Resolution Radiometer (AVHRR) 1992–1999, (ii) SPOT-Vegetation (SPOT-VGT) 1998 –2012 and (iii) PROBA-Vegetation (PROBA-V) 2013–2019, (iv), SENTINEL-3 Ocean and Land Colour (S3-OLCI) Instrument (2020), (v) and the SENTINEL-3 Ocean and Land Colour (S3-OLCI) Instrument and the SENTINEL-3 Sea and Land Surface Temperature Radiometer (S3-SLSTR) (2021 & 2022). A per-pixel trajectory-based change detection method allowed capturing 15 major LC transitions among 9 IPCC land cover categories: cropland, forest, grassland, wetland, settlement, shrubland, sparse vegetation, bare area and water. LCC is referred to as a permanent modification of the nature of the LC, that is, a change visible for at least 2 consecutive years. Up to 7 LCC were captured per pixel in 31 years. Conceptually and methodologically decoupling the LC classification and LCC detection ensures temporal and spatial consistency between successive maps.
Uncertainty and Accuracy
A validation reference database of 2700 photo-interpreted samples was built by an independent network of land cover experts for 2000, 2005, and 2010 and updated annually since 2016. The maps average overall accuracy for the 2016 – 2022 period is estimated at 70.77% (std = 0.28) based on 1344 samples interpreted with “high confidence” and made of a single LC class covering at least 90% of the area of the validation unit.
Dataset Sustainment
The Copernicus C3S service has decided in 2021 to continue funding the production of the global land cover for the coming years.
Different strategies are envisaged to maintain continuity while taking advantage of the evolving knowledge of global land cover mapping.
Technical Characteristics
Spatial resolution: 300m
Geographical coverage: Global
Temporal coverage: Annual data 1992-2022
Update frequency: Annual
Format: GeoTIFF, NETCDF4
Versions: Version 2.0.7 provides the LC maps for 1992 – 2015; version 2.1.1 for the years after 2016. Both versions are produced with the same processing chain.
Associated Guidance or User Manual
Viewer
ESA CCI Land Cover Component
User Manual
Validation Report
Web address for dataset download: NETCDF and GeoTIFF, NETCDF
Points of contact for queries
Prof. Pierre Defourny
Scientific Leader
UCLouvain-Geomatics (Belgium)
Email: pierre.defourny@uclouvain.be
Céline Lamarche
Scientific and Project Manager
UCLouvain-Geomatics (Belgium)
Email: celine.lamarche@uclouvain.be
Clément Albergel
European Space Agency
Email: Clement.Albergel@esa.int