Global tree cover loss is generated annually by the University of Maryland’s Global Land Analysis and Discovery (GLAD) laboratory as an operational product for the World Resources Institute’s (WRI) Global Forest Watch initiative. A new product, 5-year epochal global tree height maps, will be delivered in 2021 as part of the new Global Land and Carbon Watch, also in partnership with WRI.
For COP-26, GLAD will present these maps along with time-series global land cover and land use change dynamics as prototypes for comprehensive global land monitoring.
Dataset Description
Global tree cover loss is generated annually by the University of Maryland’s Global Land Analysis and Discovery (GLAD) laboratory as an operational product for the World Resources Institute’s (WRI) Global Forest Watch initiative. A new product, 5-year epochal global tree height maps, will be delivered in 2021 as part of the new Global Land and Carbon Watch, also in partnership with WRI.
For COP-26, GLAD will present these maps along with time-series global land cover and land use change dynamics as prototypes for comprehensive global land monitoring.
Usage
Users should keep in mind that the GFW dataset is a global-scale dataset, generated with a single methodology applied over all regions, and as such, the accuracy of the map may vary between locations and at different spatial resolutions. The dataset can therefore be expected to be most useful for countries that do not have their own forest monitoring systems.
GLAD time-series maps of forest loss are a largely viable relative indicator of trends, care must be taken when comparing mapped change across any interval. Applying a temporal filter, for example a 3-year moving average, is often useful in discerning trends. However, definitive area estimation should not be made using pixels counts from the forest loss layers. The Intergovernmental Panel on Climate Change (IPCC) and the Global Forest Observations Initiative (GFOI) provide guidance on reporting areal extent and change of forests, requiring the use of estimators that neither over or underestimate dynamics to the degree possible, and that have known uncertainties. The maps provided by GLAD can be leveraged to facilitate appropriate probability-based statistical methods in deriving statistically valid areas of forest extent and change. Specifically, the maps may be used as a stratifier in targeting forest extent and/or change by a probability sample. The team at GLAD has demonstrated such approaches using the GLAD forest loss data in sample-based area estimation (Tyukavina et al., ERL, 2018, Turubanova et al., ERL, 2019, and Potapov et al., RSE, 2019, among others).
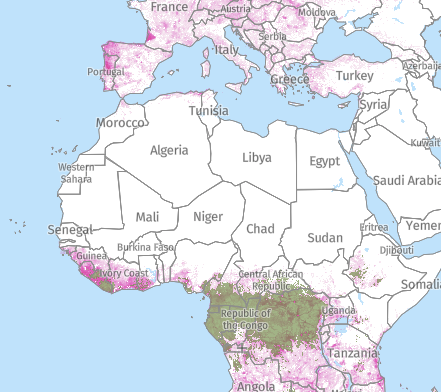
The global forest loss layer is divided into 10x10 degree tiles, consisting of seven files per tile. All files contain unsigned 8-bit values and have a spatial resolution of 1 arc-second per pixel, or approximately 30 metres per pixel at the equator. The year of forest cover loss layer depicts forest loss during the period 2000–2020, defined as a stand-replacement disturbance, or a change from a forest to non-forest state. Encoded as either 0 (no loss) or else a value in the range 1–20, representing loss detected in the years 2001–2020, inclusive.
Uncertainty and Accuracy
Errors are unavoidable in data that attempt to simplify the world—in the case of the GLAD global tree cover data into categories of tree cover loss, gain and no change. A recent assessment of the global forest watch tree cover 2000 in China suggested a high overall accuracy reaching 94.5 %. The user’s and producer’s accuracy of forest classification was 89.26 % and 82.13 %. A study of humid tropical primary forest extent and loss (Turubanova et al. 2018) found high accuracies for extent (99.28%, 99.02%, 99.45% user's and 96.84%, 96.65%, 96.75% producer's accuracies for the Americas, Africa and Asia, respectively) and loss (95.83% 86.43%, 97.57% user's and 80.34%, 63.21%, 86.21% producer's for the Americas, Africa and Asia, respectively). Higher error rates can result from a number of factors, including:
Low density tree cover canopy, such as that found in the subtropical biome, which makes it harder to detect loss because the change from tree cover to bare ground is less noticeable than in a dense forest.
Small-scale clearings, like those prevalent in Sub-Sahara Africa, which are more likely to get missed or underestimated by the data set because they have more edges compared to their area. Pixels on the edges of clearings are often blurred in satellite images, so the data misses a lot of “loss” in these small patches.
Gradual changes, like tree cover gain, which are more difficult to detect than sudden changes.
When deciding if it is appropriate to use the data for your needs, the first step is to understand the accuracy of the data. The next step is to determine how the precision and possible errors may impact your specific application. The question of whether the data is accurate enough will be different for each use case, but here are some general guidelines:
Investigate trends and patterns at large scales: The global error rates are relatively low compared to similar data sets, so we can feel confident using the data to examine trends and patterns at large scales (e.g., global, regional, national).
Use 3-year averages: Given year-to-year uncertainties, we recommend using 3-year averages. Clouds literally get in the way of what satellites can “see,” especially in the humid tropics where clouds can obscure the view below for much of the year. That means that occasionally trees may be felled or burned under the cover of clouds and it may not be detected until the following year. Users of the data can smooth out such uncertainty by examining the average over multiple years.
Assess general locations of loss: While the accuracy was not assessed at local scales, we know that most missed “loss” occurs on edges and so we can confidently use the data to identify the general location of loss locally.
Use caution with local measurements: However, making precise measurements locally (e.g. hectares of tree cover loss, carbon emitted from deforestation) requires further information on accuracy in that particular location—for example, through knowledge of the local context, satellite imagery, comparing to other forest change data, etc.
Match your confidence to the accuracy: Avoid making strong claims based on data with low accuracy (i.e. areas with low canopy density, tree cover gain, etc.).
Format: The GFW Open Data Portal is available for data discovery and visualisation. Data tiles may also be downloaded directly, or analysed in Google Earth Engine where the data already resides. Further details here.
Data Policy: Public open (Creative Commons CC BY 4.0)