Dataset Description
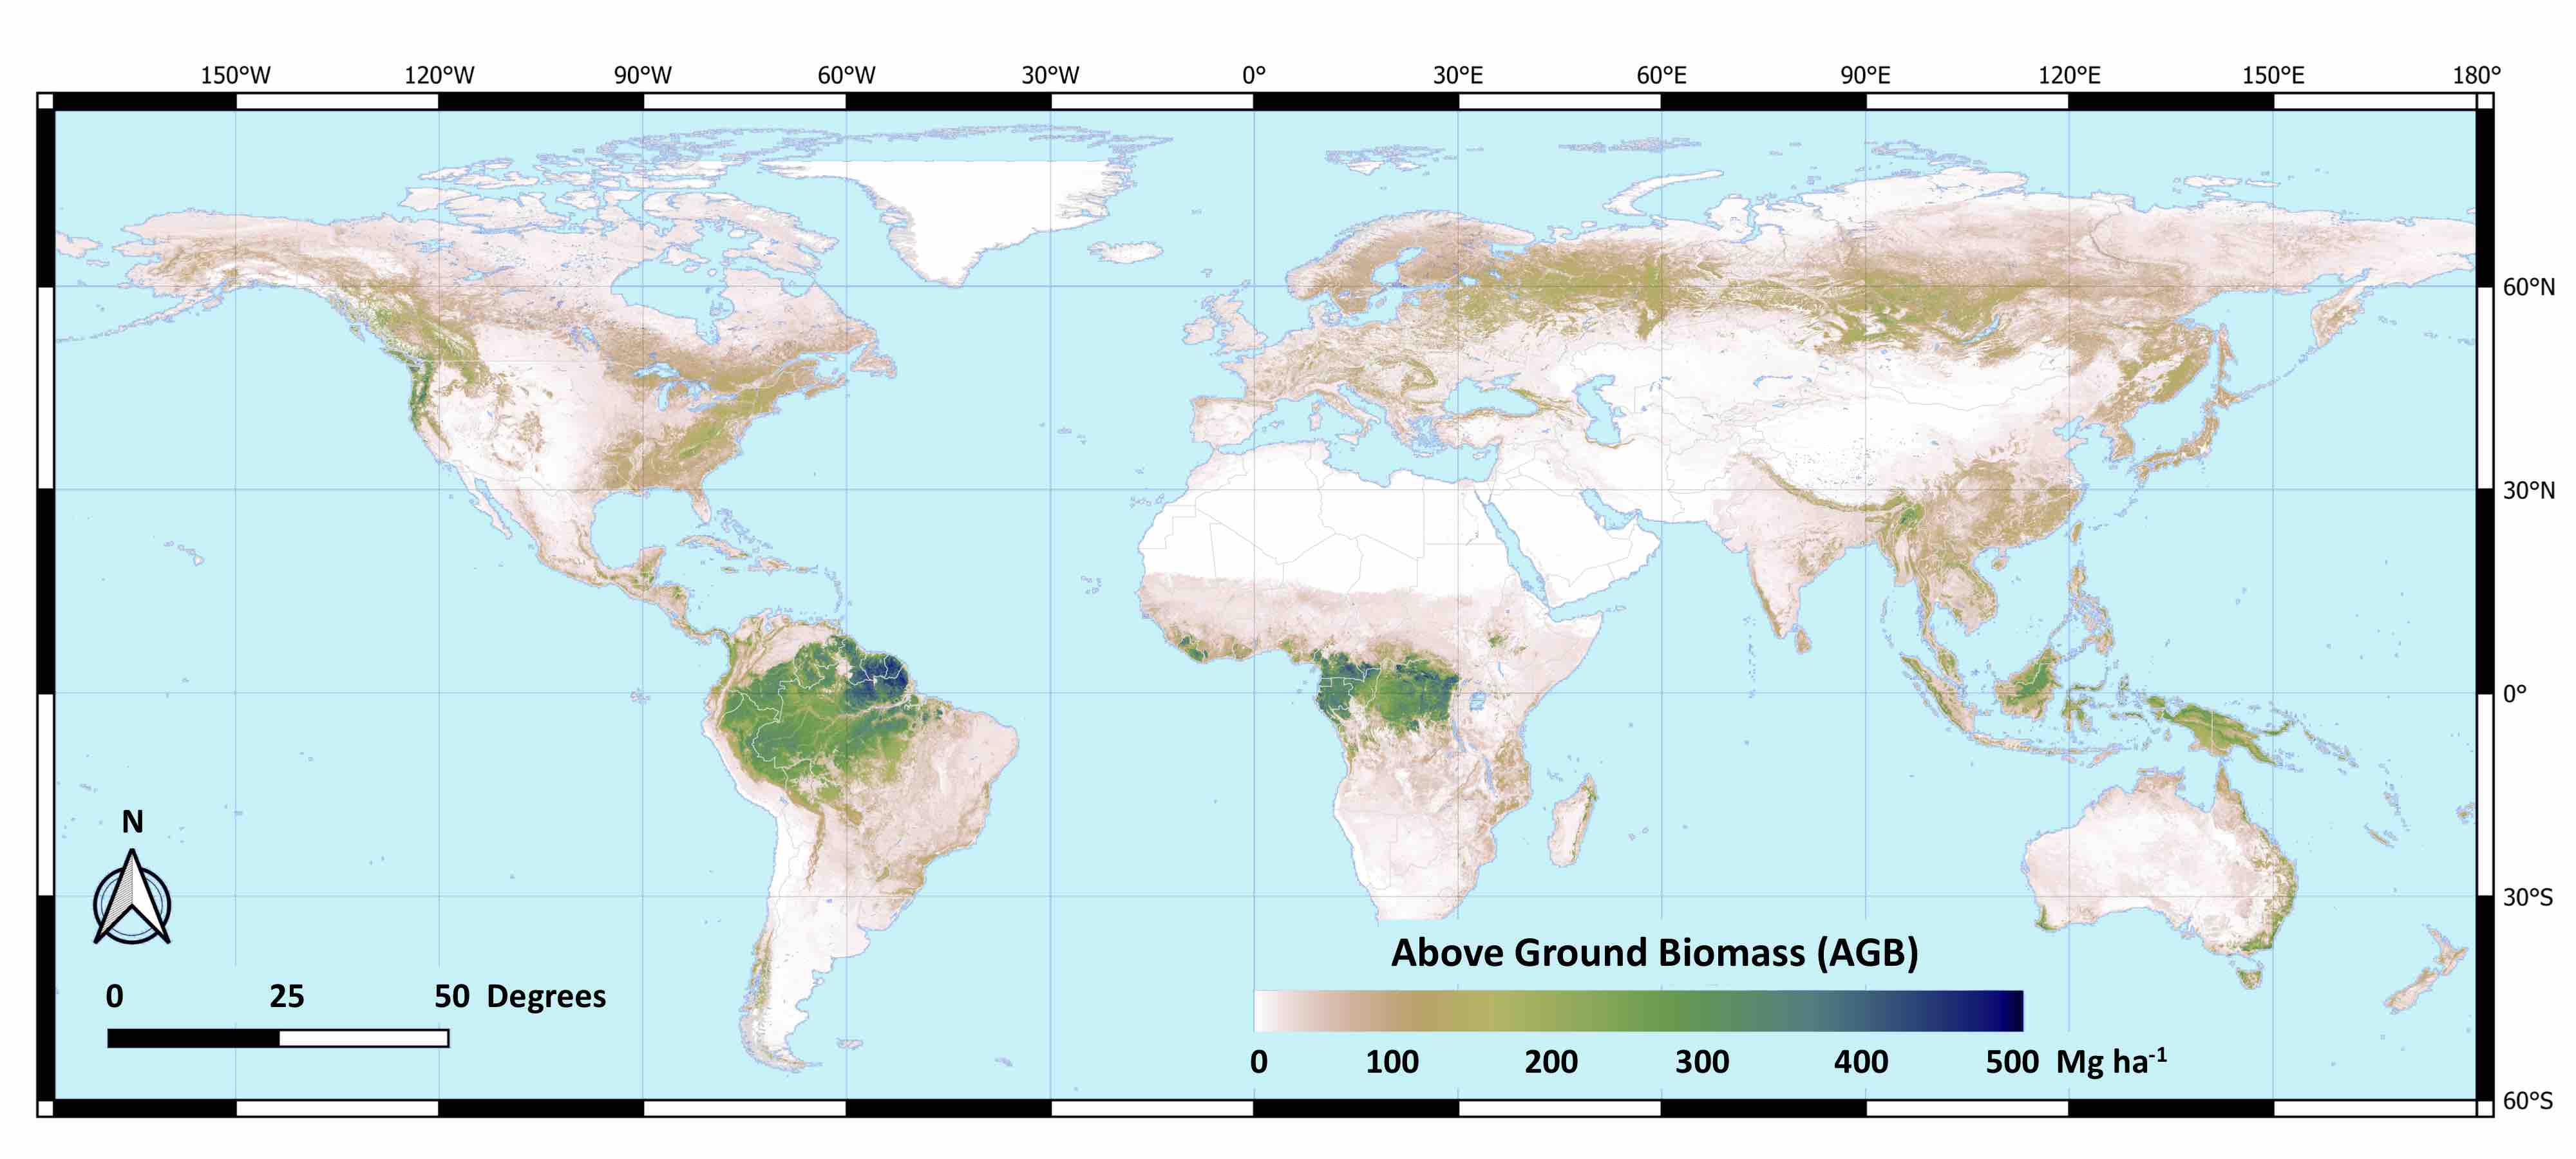
The JPL 2020 map is the global aboveground biomass (AGB) density estimates (unit: Mg/ha) derived from a combination of Landsat-8 composites, ALOS-2 PALSAR-2 backscatter (2019-2020) data and SRTM DEM at 100m spatial resolution, trained with samples from the spaceborne lidar data of ICESAT-1, airborne laser scanning (ALS) data, and field inventory data. We applied the boosting tree machine learning model to predict wall-to-wall AGB inferred from satellite data.
The product shared on the Multi-Mission Algorithm and Analysis Platform (MAAP) is separated continentally, including Africa, Asia, Europe, N America, Oceania, and S America. One can merge the 6 files to obtain the global mosaic.
Usage
The data product contains the mean AGB density estimates at 100m spatial resolution for the year of 2020, and the standard error of the mean estimates at pixel level as a separate data file with the same dimension and spatial coverage. Files are saved in Cloud Optimized Geotiff (COG) format with a scaling factor of 10. Users should divide the map values by 10 to get the AGB estimates in Mg/ha.
The AGB estimation from the current set of training samples (e.g. the use of ICESAT-1) may have time lags between samples and predictive layers. We ensured in the methodology to eliminate such differences, but the residual effect may still exist. We will replace ICESAT-1 with GEDI data in the new version of AGB 2020 estimation.
Some known issues of the map include the artifacts in tropical regions where residual effects due to cloud contamination still exist, which may also cause misclassification of the land cover map that we used. There are also some mosaicking issues in northern Siberia due to the use of ALOS-2 data, which can be visible when conducting local-scale studies.
The AGB estimation product files stored on MAAP can be found at /shared_bucket/alanxuliang/AGB_2020. It is also possible to download directly from AWS. The recommended way of downloading is to use the associated notebook file “map_download.ipynb” in the folder.
For desktop users, it is also possible to copy the selected URL from the notebook and paste into internet browsers for direct download. For visualization, desktop users can also open QGIS and add a new raster layer by choosing the HTTP protocol (paste the URL there with no authentication).
Methodology
We compiled the AGB training samples from 4 sources of data, including the spaceborne ICESAT-1 product calibrated to have AGB estimates using more than 40 lidar biomass models across different forest types that coverts lidar waveform metrics to biomass, the Airborne Laser Scanning data across different regions converted to AGB at 1-ha spatial resolution from field data, sample forest inventory data available from research community and some regional and national inventory, and sample training data from mangrove AGB estimates across global coastal regions.
We produced clean version of satellite layers by masking out cloud pixels and extending the observational period for more valid pixels. Landsat-8 data were cross-calibrated with MODIS NBAR data to remove the bi-directional reflectance effect in the forested region, and the ALOS-2 data were cross-calibrated with the mean signal of ALOS-1 (2007-2010) to remove the residual effect of local incidence angles, orbital stripping because of changes of environmental conditions. The cross-calibration is performed at large scales to make sure local changes of ALOS-2 PALSAR-2 due to disturbance and recover of vegetation is preserved.
We built masks to filter out training samples that experienced potential changes from the acquisitions of AGB samples to the time period of satellite observations. The Global Forest Change data were used to remove potential deforestation pixels. The MODIS burned area product (MCD64) was used to remove potential fire pixels. Further layers using vegetation indices (NDVI and QVI) were used to filter out other changes. This filtering helped to include only training data that represent the landscapes that have not gone through significant change.
For each forest type and main non-forest vegetation type, we built the Light Gradient Boosting Machine (LightGBM) model by assigning equal weights to all 4 sources of training data. The machine learning model for each vegetation type was fine-tuned for hyperparameters using cross-validation.
The predicted values were further corrected using the generic bias correction model and the local-scale histogram matching by taking equal-area-weighted training samples to compare histograms.
Areas showing recent disturbances were processed to have an additional correction using an empirical correction factor derived from Landsat-8 spectral index. Non-vegetated areas were masked to have zero AGB estimates.
Uncertainty and Accuracy
The uncertainty map in the AGB 2020 product was produced using quantile regression to calculate the lower- and upper-bound of the estimation for each pixel, such that the 2.5-percentile and 97.5-percentile of the AGB estimation were predicted.
The error map was produced by assuming that the error distribution is Gaussian. Therefore 95% of the predictions are approximately ±2SD. SD is reported in the final error map.
We did not take the error of training samples into the error propagation. When uncertainties from samples (due to measurement errors, allometries, geolocation, etc.) are considered, the pixel level uncertainty can be much larger.
The model uncertainty is not considered at pixel level. However, it is necessary to take this into account when calculating regional means and totals (jurisdictional estimates). Random sampling approximations will be applied to approximate the error covariance matrix due to model uncertainty.
Dataset Sustainment
We will continue to improve the map by incorporating contemporary GEDI and ICESAT-2 data to replace the samples of ICESAT-1. All GEDI data have been already processed and rasterized using multiple GEDI waveforms (> 3) within 100 m grid cells. The ICESAT-2 will be incorporated from available data on MAAP for only the boreal regions. The updates of the biomass map will be available within 3-6 months.
The model uncertainty will be provided in an efficient format to have a simple way representing the error matrix.
Technical Characteristics
Spatial resolution: ~100m
Geographical coverage: Global
Temporal coverage: 2020
Update frequency: Annual
Format: GeoTIFF
Data Policy: Creative Commons Attribution 4.0 International (CC-BY-4.0)
Associated Guidance or User Manual
All datasets will be provided for public use at:
https://carbon.nasa.gov
https://lpdaac.usgs.gov
Product manual, validation report, and dataset links are not yet available (October 2021), but will be available from:
https://carbon.nasa.gov
Points of contact for queries
Sassan Saatchi
Principal Scientist
Jet Propulsion Laboratory
California Institute of Technology
Pasadena, CA USA
Email: saatchi@jpl.nasa.gov
Liang Xu
Research Scientist
Jet Propulsion Laboratory
California Institute of Technology
Pasadena, CA USA
Email: alan.xu@jpl.nasa.gov
Yan Yang
Postdoc
Jet Propulsion Laboratory
California Institute of Technology
Pasadena, CA USA
Email: yan.yang@jpl.nasa.gov