Dataset Description
Methane is emitted by a broad range of natural processes and human activities. The NASA Carbon Monitoring System Flux (CMS-Flux) team analyzed remote sensing observations from Japan’s Greenhouse gases Observing SATellite (GOSAT) to produce national-scale CH
4 emission budgets. They used an analytic Bayesian inversion approach and the GEOS-Chem global chemistry transport model to quantify emissions and their uncertainties at a spatial resolution of 1° by 1° and then projected these to each country. Unlike the pilot CO
2 inventories, these CH
4 budgets optimize emissions from fossil fuel extraction, transport and use as well as those from wetlands and inland freshwaters, agriculture, waste and fires.
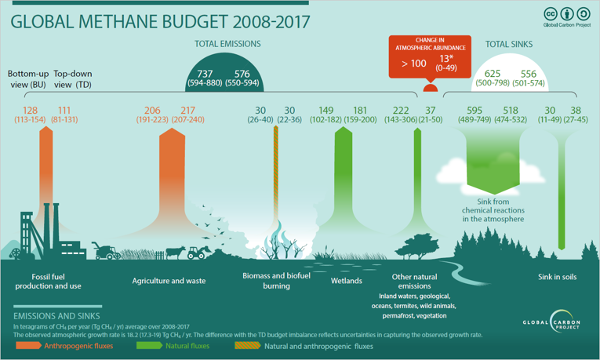 Global methane (CH4) budget for the period 2008–2017 (plot taken from Saunois et al., ESSD 2020). Processes that emit methane (CH4) into the atmosphere (upward arrows) as well as their relative contributions can be seen from the numbers. The orange colored arrows indicate anthropogenic sources and the green colored arrows indicate the sources of natural origin. The major loss processes are depicted by the down arrows. For details on data sources, please refer to Saunois et al. (Earth Syst. Sci. Data, 12, 1561–1623, 2020. doi:10.5194/essd-12-1561-202).
Methodology
Methane emissions and their uncertainties for 2019, were derived by sector, at 1-degree latitude-longitude resolution and then projected to country-scale resolution. Top-down fluxes are based on spatially resolved estimates of the column average methane dry air mole fraction, XCH4, derived from measurements returned by Japan’s GOSAT satellite. These data are analyzed using the GEOS-Chem global chemistry transport model and quantified using an analytic Bayesian inversion approach. This approach allows us to project these fluxes to emission sectors by accounting for the spatial structure of the emission uncertainties as opposed to assuming that emissions are 100% correlated within a model grid cell (fluxes are evenly projected back to emissions with equal weighting) as is typically assumed with top-down flux methods. This combination of algorithms allows us to project fluxes to emissions at arbitrary scales as long as the emission inventories and corresponding uncertainties are provided at these same scales.
This approach also allows us to report uncertainties that are due to the limited spatial resolution of the fluxes and structure of the prior emission uncertainties (also called representation error or smoothing error). However, systematic errors resulting from the chemistry-transport model used to relate emissions to concentrations are not reported, although the flux inversion approach does mitigate these errors. Based on other analysis reported in the literature we expect that systematic errors in the model add uncertainty that is at least as large as the uncertainties reported in this document. Emissions presented here should be considered as “Pilot” data intended to complement existing research. For example, researchers could use reported discrepancies between these top-down and bottom up estimates as a starting point for further investigation.
Summary of Results
- The existing observation and analysis system (GOSAT data + GEOS-Chem) can quantify total emissions for about 58 of the 242 countries.
- Both top-down and bottom up estimates indicate that the largest CH4 emissions are from the agricultural sector (including waste/manure management), primarily livestock (enteric fermentation).
- Both top-down and bottom up estimates indicated that the top five emitting countries are responsible for about half (~170 Tg CH4/yr) of the global anthropogenic CH4 emission budget.
- It is challenging to reconcile recent reports of very large methane emissions from wetland plus aquatic sources (e.g. rivers, lakes, reservoirs, aquaculture) (~219-394 Tg CH4/yr) with the top-down fluxes reported here. A caveat to this conclusion is that rice farming and livestock emissions are indistinguishable from nearby, unspecified, aquatic emissions using remote sensing, highlighting a need for further research.
- It is also challenging to reconcile these global top-down fossil emissions (Coal + Oil + Gas) based on remote sensing observation (80 to 100 Tg CH4/ yr) with the much larger values inferred from in situ isotopic information (~160 +/- 20 Tg CH4/yr) and prior inventories (e.g., ~97 +/- 23 to 128 +/- 15 Tg CH4/yr). We find that fossil emissions tend to be spatially distinct from other emission sources and therefore are well resolved by remote sensing. At present time we cannot resolve this discrepancy between remote sensing estimates and these other approaches.
- The sum of Agriculture, waste emissions, and fire emissions is 276 +/- 26 Tg CH4/yr, larger than the prior emissions of 197 +/- 46 Tg CH4/yr. These results are larger than but consistent (within reported uncertainties) with previous estimates of ~242 Tg CH4/yr based on remote sensing or in situ data.
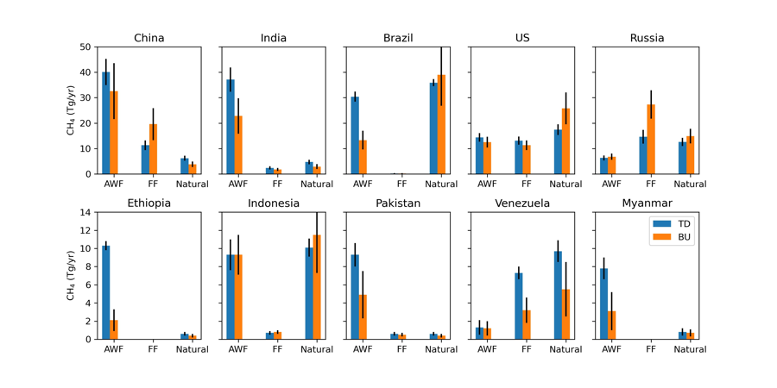 Top-down (TD, blue) and bottom-up (BU, orange) methane emissions by sector from the top 10 emitting countries are compared. The sectors shown include Agriculture, Waste and Fires (AWF), Fossil Fuels (FF), and Natural sources, such as wetlands and seeps.
Technical Characteristics
Spatial resolution: 1-degree latitude by 1-degree longitude and national
Geographical coverage: Global
Temporal coverage: 2019
Update frequency: Annual
Format: Spreadsheet (.csv), netCDF, GeoTIFF
Data Policy: Open
Emissions by country
Gridded emissions and uncertainties
Worden, J. R. et al. The 2019 methane budget and uncertainties at 1∘ resolution and each country through Bayesian integration Of GOSAT total column methane data and a priori inventory estimates. Atmos Chem Phys 22, 6811–6841 (2022). https://acp.copernicus.org/articles/22/6811/2022/
Associated Guidance or User Manual
Under development
Points of contact for queries
John Worden
NASA/JPL
Email: john.r.worden@jpl.nasa.gov