Dataset Description
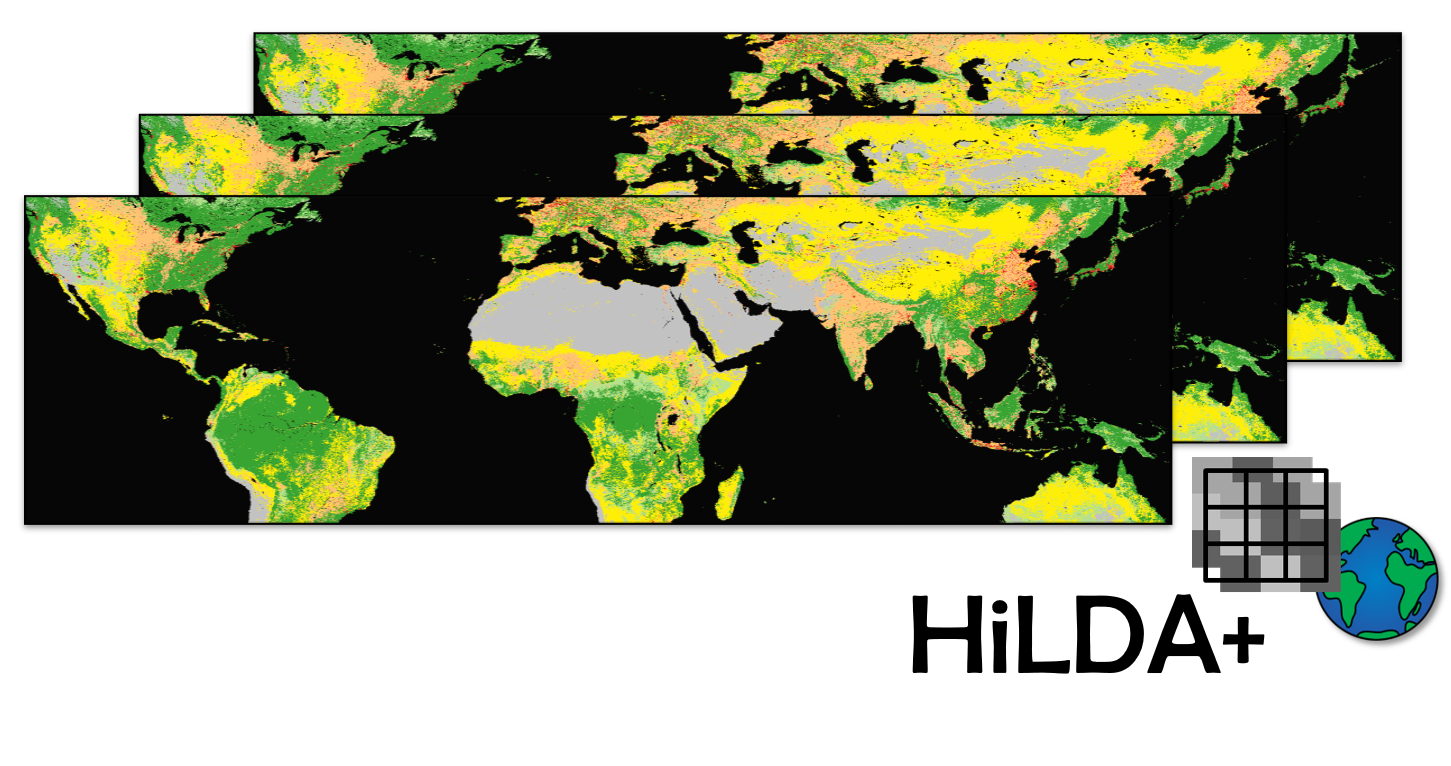
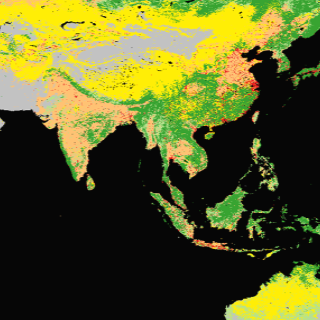
HILDA+ (HIstoric Land Dynamics Assessment+) is a global dataset on annual land use/cover change between 1960 and 2019 at 1 km spatial resolution. It is based on a data-driven reconstruction approach and integrates multiple open data streams (from high-resolution remote sensing, long-term land use reconstructions and statistics). It covers six generic land use/cover categories: 1: Urban areas, 2: Cropland, 3: Pasture/rangeland, 4: Forest, 5: Unmanaged grass/shrubland, 6: Sparse/no vegetation.
Usage
HILDA+ is provided in different spatial dataset types and version, which can be accessed as ZIP folders:
- vGLOB-1.0_geotiff: Land use/cover states and transition layers as multiple single geotiffs from 1960 to 2019.
- vGLOB-1.0-f_netcdf: Land use/cover states and transition layers as two large netCDF files with extended time span from 1899 to 2019. This dataset includes forest class sub-division and dynamics. Because its temporal extension, the dataset is a suitable input for global climate, earth system as well as biodiversity models, which may need a longer spin-up phase.
- hildap_vGLOB-1.0_change-layers: HILDA+ change layers (change frequency; forest, cropland and pasture/rangeland change between 1960 and 2019) are provided as geotiffs.
- hildap_vGLOB-1.0_uncertainty: Uncertainty layers are provided as geotiffs in three different ZIP folders (part1-3), containing annual datasets of uncertainty information: Number of input datasets, deviation and average area fraction per land use/cover category.
Note that precise accuracy metrics cannot be provided due to missing independent reference data covering the entire period. The deviation of the input datasets was used as uncertainty information, which give a hint on data quality.
Methodology
LUC change dynamics for six LUC categories (urban, cropland, pasture/rangeland, forest, unmanaged grass/shrubland, sparse/no vegetation) were reconstructed based on multiple sources of observational data, from which country-scale change extents and mean fractional area were derived per 1 × 1 km grid cell from 1960 to 2019. Country- and year-specific areas of change for each land transition between these categories were calculated. A base map for the year 2015 served as a starting point for the change allocation procedure, which, at first, runs backward in time (2015–1960) and, subsequently, forward in time (2015–2019). For each time step and country, LUC change was allocated to selected candidate pixels by using ranked gridded class fractions and the data-derived change extents. Each of these iterative procedures yielded a global LUC map, which served as the new base map for the next time step. The following methodological steps were included in the data development:
- Pre-processing and harmonisation of land use/cover maps: Reclassifying with a common generalised classification scheme• Probability maps for land use/cover categories: Annual maps of the average area fractions of each land use/cover category. Based on this, probability maps for the final LUC categories were derived, which were the basis of the change allocation procedure.
- Probability maps for land use/cover categories: Annual maps of the average area fractions of each land use/cover category. Based on this, probability maps for the final LUC categories were derived, which were the basis of the change allocation procedure.
- Base map calibration (calibrating the Copernicus LC100 Global Land Cover map for the reference year 2015 to FAO land use statistics).
- Preparing datasets for national LUC change matrices based on FAO statistics (annual net changes per country) and remote sensing products (annual gross changes per country).
- Change allocation: Based on the recalculated country- and year-specific transition matrices, the magnitude of LUC change was distributed over the grid by means of corresponding probability maps for each LUC category. This procedure was undertaken iteratively for each year (in a back- and forward mode starting from the base year 2015, respectively), for each individual country and for each land transition between two LUC categories. The output of each change allocation step of the annual loop was a new global map of LUC, which served as the base map for the next processing step.
- Updates are anticipated every three years as FAO land use statistics are extended.
Uncertainty and Accuracy
Annual layers of uncertainty information based on the available input LUC datasets are included in the dataset. The number of available datasets, the maximum deviation in class area fraction and the mean class area fraction from all available datasets per year were used to generate per-pixel quality information.
Dataset agreement differs per category. Forests and areas with sparse/no vegetation show the highest agreements. On the other hand, dataset deviation is larger in agricultural categories cropland and pasture/rangeland. Especially in heterogeneous landscapes, which hold a mix of managed and unmanaged lands, land use/cover class coverage is ambiguous (lower area fractions) and, thus, dataset information deviates.
Dataset Sustainment
Plans/funding to sustain: Regular updates are planned.
Technical Characteristics
Spatial resolution: 0.00998837° (~1 km)
Geographical coverage: Global
Temporal coverage: 1960-2019 / 1899-2019 (extended version)
Update frequency: Annual
Format: Geocoded raster (GeoTIFF and NetCDF)
Projection: EPSG: 4326 - WGS 84 – Geographic
Class codes (for stable categories): 00 ocean, 11 urban, 22 cropland, 33 pasture/rangeland, 44 forest, 55 unmanaged grass/shrubland, 66 sparse/no vegetation, 77 water, 99 no data
Data Policy: Creative Commons Attribution 4.0 International (CC-BY-4.0)
Associated Guidance or User Manual
Interactive HILDA+ map viewer:
https://landchangestories.org/hildaplus-mapviewer/
Web address for dataset download and description:
https://doi.pangaea.de/10.1594/PANGAEA.921846?format=html#download
Reference publication (use for citations):
https://www.nature.com/articles/s41467-021-22702-2
Points of contact for queries
Karina Winkler
Doctoral researcher
Wageningen University & Research (WUR)
c/o Karlsruhe Institute of Technology (KIT), Institute of Meteorology and Climate Research (IMK-IFU), Kreuzeckbahnstrasse 19, 82467 Garmisch-Partenkirchen, Germany
Email: karina.winkler@kit.edu