Tracking Greenhouse Gas Emissions and Removals – the Paris Agreement
Recognizing that anthropogenic emissions of carbon dioxide (CO
2), methane (CH
4) and other greenhouse gases (GHGs) are the primary cause of global warming, Parties to the Paris Agreement resolved to rapidly reduce these emissions. To track progress toward this goal, they are compiling national inventories of GHG emissions and removals, which will be evaluated at 5-year intervals as part of the Global Stocktakes (GSTs).
These inventories are compiled using best practices recommended in the Intergovernmental Panel on Climate Change (IPCC) Guidelines for National Greenhouse Gas Inventories, which require reports of annual emissions by sources and removals by sinks in specific sectors and categories. The net emissions and removals in each category of each sector is approximated either by multiplying the measured activity data (i.e. number of liters of oil or tons of coal burned) by an assumed emission factor (number of kilograms CO
2 emitted per liter of oil or ton of coal) or by sampling carbon stock changes directly, and summing the results to yield totals.
These bottom-up methods can yield reliable results for CO
2 emissions for categories within the Energy sector, such as fossil fuel combustion, when emissions can be accurately estimated from the amount and type of fuel burned because the carbon content of the fuel is well understood and the oxidation factors are close to one. However, they are often less reliable in other sectors and categories, such as Land Use category in the Agriculture, Forestry and Other Land Use (AFOLU) sector, where emission or removal processes are much more diverse and difficult to quantify.
Top-down Atmospheric GHG Budgets
CO
2 and CH
4 emissions and removals can also be quantified using high-resolution, time-resolved measurements of their concentrations in the atmosphere. Sources of CO
2 or CH
4 emissions increase their downwind concentrations, while removals by sinks decrease their downwind concentrations. To infer net surface-atmosphere fluxes, CO
2 and CH
4 measurements are analyzed with atmospheric inverse models. These models derive estimates of flux distributions that are consistent with the observed atmospheric concentrations in the presence of the wind field. The resulting top-down flux budgets are less source specific than bottom-up inventories, but complement those methods by providing an integrated constraint on net emissions from all sources and sinks on spatial scales spanning individual large power plants or urban areas to nations or the entire globe. So, while these top-down atmospheric GHG budgets will never replace the bottom-up inventories, these top-down and bottom-up products can be combined to produce a more complete and transparent assessment of progress toward GHG emission reduction targets.
Ground-based and airborne in situ measurements collected by the World Meteorological Organization (WMO) Global Atmospheric Watch (GAW) Network continue to provide the most accurate estimates of GHG concentrations and their trends on global scales. Satellite sensors including Japan’s Greenhouse gases Observing SATellite (GOSAT) and GOSAT-2, NASA’s Orbiting Carbon Observatories (OCO) 2 and 3, and the European Copernicus Sentinel 5 Precursor TROPOMI are returning spatially-resolved measurements of CO
2 and CH
4 at over the globe. These datasets are analyzed with atmospheric inverse modeling systems to yield top-down estimates of the emissions and removals of these two critical greenhouse gases on policy relevant scales, increasing their potential value in the context of the GST.
The current ground-based, airborne and space-based GHG measurement and modeling systems have the spatial resolution or coverage needed to quantify net emissions or removals from medium to large nations (i.e. Russia, U.S., China, India), but do not yet provide the coverage and resolution needed to accurately quantify CO
2 or CH
4 sources and sinks in smaller nations (i.e. Sri Lanka, Austria, Panama). However, the capabilities of these systems are growing rapidly. With these updates, these top-down methods could support both the development of national inventories and serve as part of a transparent Monitoring and Verification System (MVS) for quality control and quality assurance of bottom-up inventories, like that anticipated in the IPCC Guidelines for National Greenhouse Gas Inventories.
Pilot Top-Down Products for Starting a Conversation
To demonstrate the current state-of-the-art in top-down methods for tracking CO
2 and CH
4 emissions and removals, the Joint CEOS/CGMS Working Group on Climate (WGClimate) Greenhouse Gas Task Team has worked with the inverse modeling community to compile pilot top-down budgets of CO
2 and CH
4 emissions at national scales to support the first GST in 2023. While these first-generation products do not yet have the accuracy, resolution, and coverage needed to serve as an independent Monitoring and Verification System, they clearly illustrate the strengths and weaknesses of this approach and serve as an important bridge between emissions, which are the primary means of mitigation, to concentrations and are the primary drivers of climate change. They should be adequate for starting a conversation among stakeholders, the national inventory community and the GHG measurement and modeling communities to identify the best available atmospheric products and best practices for combining bottom-up and top-down GHG data to produce more complete and transparent inventories for future GSTs. They should therefore be adequate for refining the requirements for a future, purpose-built GHG MVS.
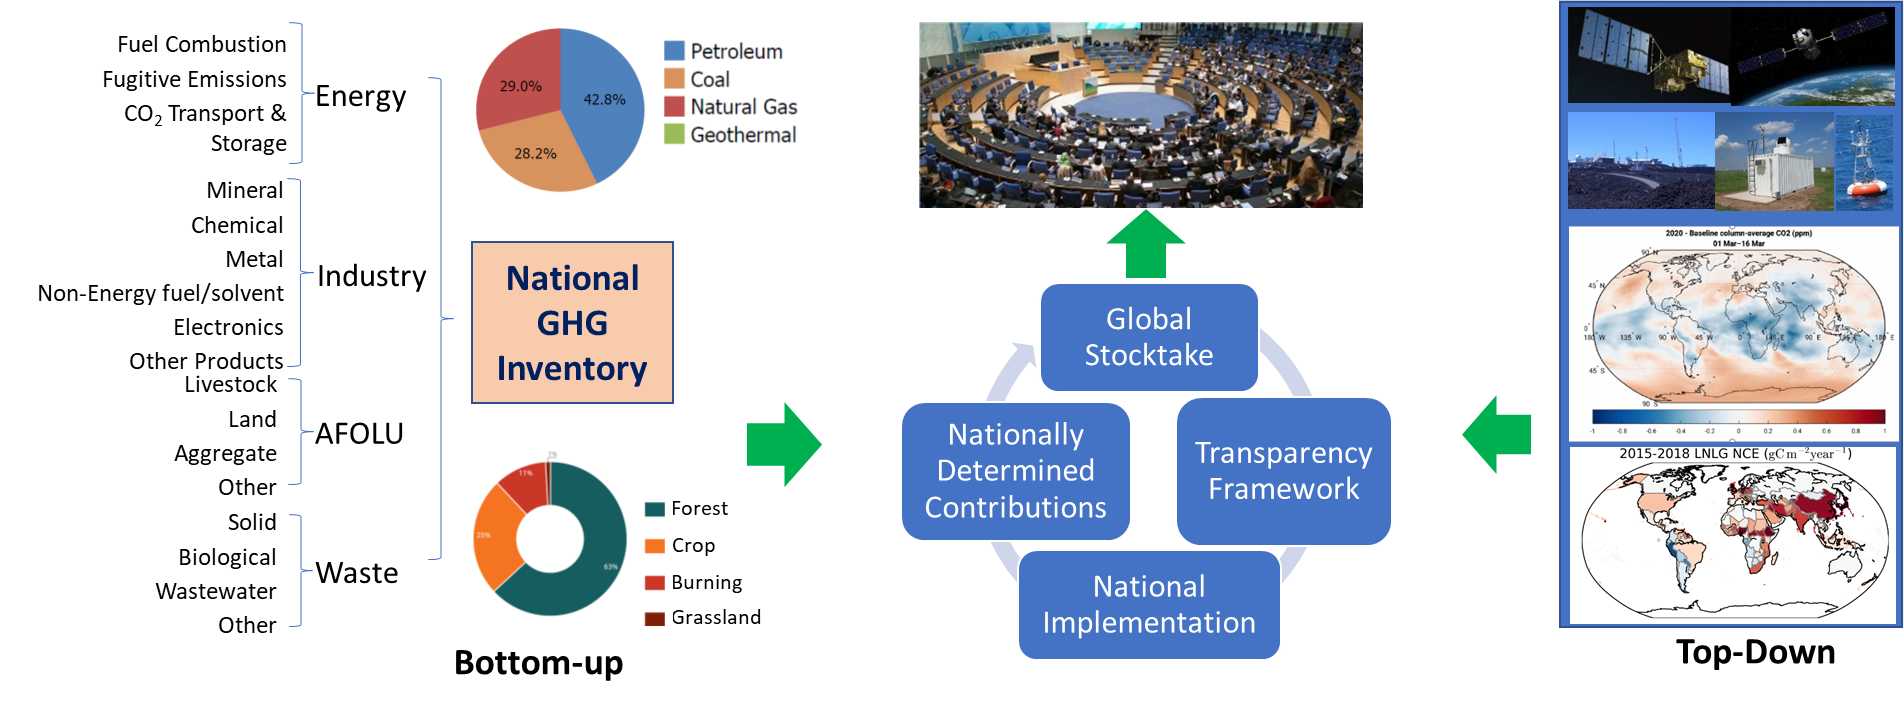 The Global Stocktake Process – (Left) Conventional GHG inventories are compiled using a bottom-up process that compiles estimates of emissions and removals from specific sectors and categories. (Right). Top-down atmospheric GHG fluxes are derived from direct measurements of atmospheric GHGs. These two methods are complementary. The bottom-up methods are more source specific, while the top-down atmospheric methods provide an integral constraint on the net emissions by all sources and sinks. In principle, it should be possible to combine these two methods to provide a more complete and transparent account of GHG emissions and removals.
Future Prospects of Top-Down Emissions Estimates
Top-down atmospheric CO
2 and CH
4 studies like those summarized here are already providing significant insights into the largest sources and sinks of CO
2 and their response to human activity and climate change. However, both the CO
2 and CH
4 groups caution that these pilot products should be interpreted with caution given limitations of the current atmospheric measurement and analysis systems.
While this system does not yet completely meet the requirements for a GHG MVS system, recent advances in ground-based, airborne, and space-based measurements of CO
2 and CH
4, combined with progress in atmospheric inverse methods are yielding substantial improvements the precision, accuracy, resolution and coverage. Timelines for the growing fleet of space-based CO
2 and CH
4 sensors operated by CEOS and CGMS agencies are shown in Figure 1. Spacecraft scheduled from launch within the next five years, including Japan’s GOSAT-GW, EDF’s MethaneSat, NASA’s GeoCarb and the Copernicus CO2M satellites are expected to provide dramatic improvements in spatial coverage and resolution for both CH
4 and CO
2. Their observations can be combined with those of high-resolution imaging missions, such as GHGSat, Sentinel 2 and PRISMA or the planned missions such as CarbonMapper to locate intense CH
4 plumes, facilitating the detection of super-emitters from oil and gas extraction, transmission, processing, and distribution facilities. Expanded ground-based and airborne systems are also expected to be deployed over this period as well, complementing the space-based systems with around-the-clock coverage, even during cloud periods and at night. The value of these data could be enhanced further if they can be harmonized to further extend the coverage and resolution and facilitate hand-off from one generation of sensors to the next.
These new measurement capabilities are driving the development of more advanced atmospheric inverse model that more fully exploit these new measurements. While the current measurement network cannot support inversions at resolutions of ~100 km, the future systems will deliver global measurements at scales as fine as 2 km by 2 km. These data could support inversions at much finer resolution, providing useful national-level constraints on emissions for much smaller countries. Other space-based measurements at resolutions as high as a few 10s of meters will drive advances in methods for modeling emission plumes from point sources such as power plants, cities, and fossil fuel extraction areas.
A key feature of these top-down atmospheric measurements in the context of a GST is their potential for transparency. Most of the ground-base, airborne and space-based data collected by public sector missions (and some private sector missions) are made freely available on publicly available archives. The methods used needed to analyze these data are complex and computationally expensive, but are currently being implemented in collaborative efforts by science teams from around the world with numerous intercomparison projects to assess the tradeoffs between different methods. If these practices are continued, it will clearly increase the value and transparency of the top-down atmospheric emissions products.
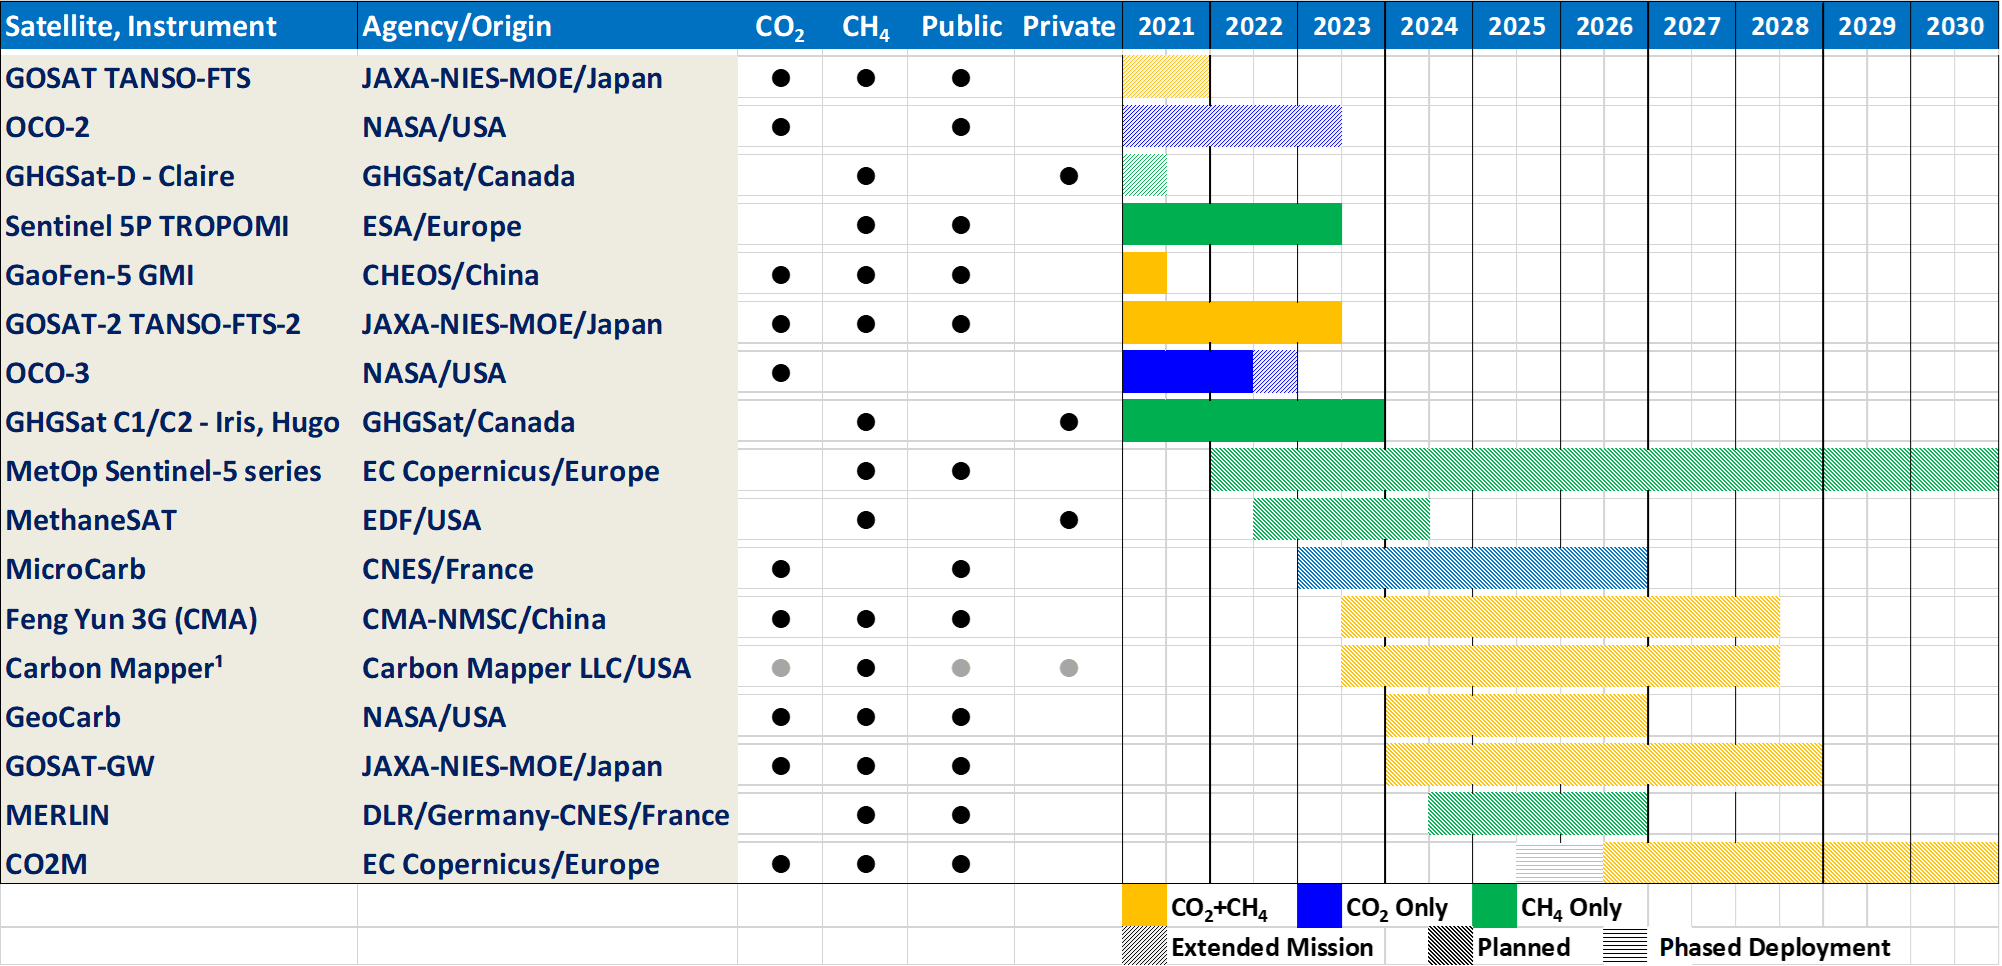 Timeline of Greenhouse Gas monitoring Satellites. Timelines for satellites that measure only CO2 are shown in blue, those that measure only CH4 are colored green, and those that measure both gases are shown in gold.