Other Land Use (OLU)    |    Wetlands

Mangroves


This dataset shows the global extent of mangroves for eleven annual epochs between 1996 and 2020, derived using a combination of optical and radar satellite data.


The dataset is supplied by Global Mangrove Watch, a collaboration between Aberystwyth University, solo Earth Observation, Wetlands International, The Nature Conservancy, and the Japan Aerospace Exploration Agency (JAXA).

Updated October 2022

Dataset Description

The Global Mangrove Watch (GMW) dataset provides estimates of the global extent and changes of mangrove forests for eleven annual epochs between 1996 and 2020. Annual updates from 2021 and onwards are foreseen as is filling temporal gaps in the historical annual time series. Geospatial (map) data and numerical area estimates are available, from which national or regional area statistics can be extracted. Mangrove losses and gains between the respective years are provided as separate data layers.

Usage

Users should keep in mind that the GMW dataset is a global-scale dataset, generated with a single methodology applied over all regions. As such, the accuracy of the map ranged from 77.8% to 99.8% but may vary between locations and with scale. The dataset can therefore be expected to be most useful for countries that do not have their own mangrove monitoring systems. With the caveats in mind, the GMW dataset can be used as activity data proxy by countries considering inclusion of Other Land Uses (Wetlands) in their Nationally Determined Contributions (NDCs) for reporting to the UNFCCC. The dataset can furthermore support national reporting on Sustainable Development Goals, specifically Task 6.6 (Protect and restore water-related ecosystems) Indicator 6.6.1 (Change in the extent of water-related ecosystems over time). To this end, GMW has been selected by the United Nations Environment Programme (UNEP) as the official 'default' mangrove dataset for SDG 6.6.1 reporting for countries that lack their own information about mangrove resources required for improved management, protection and restoration.

Methodology

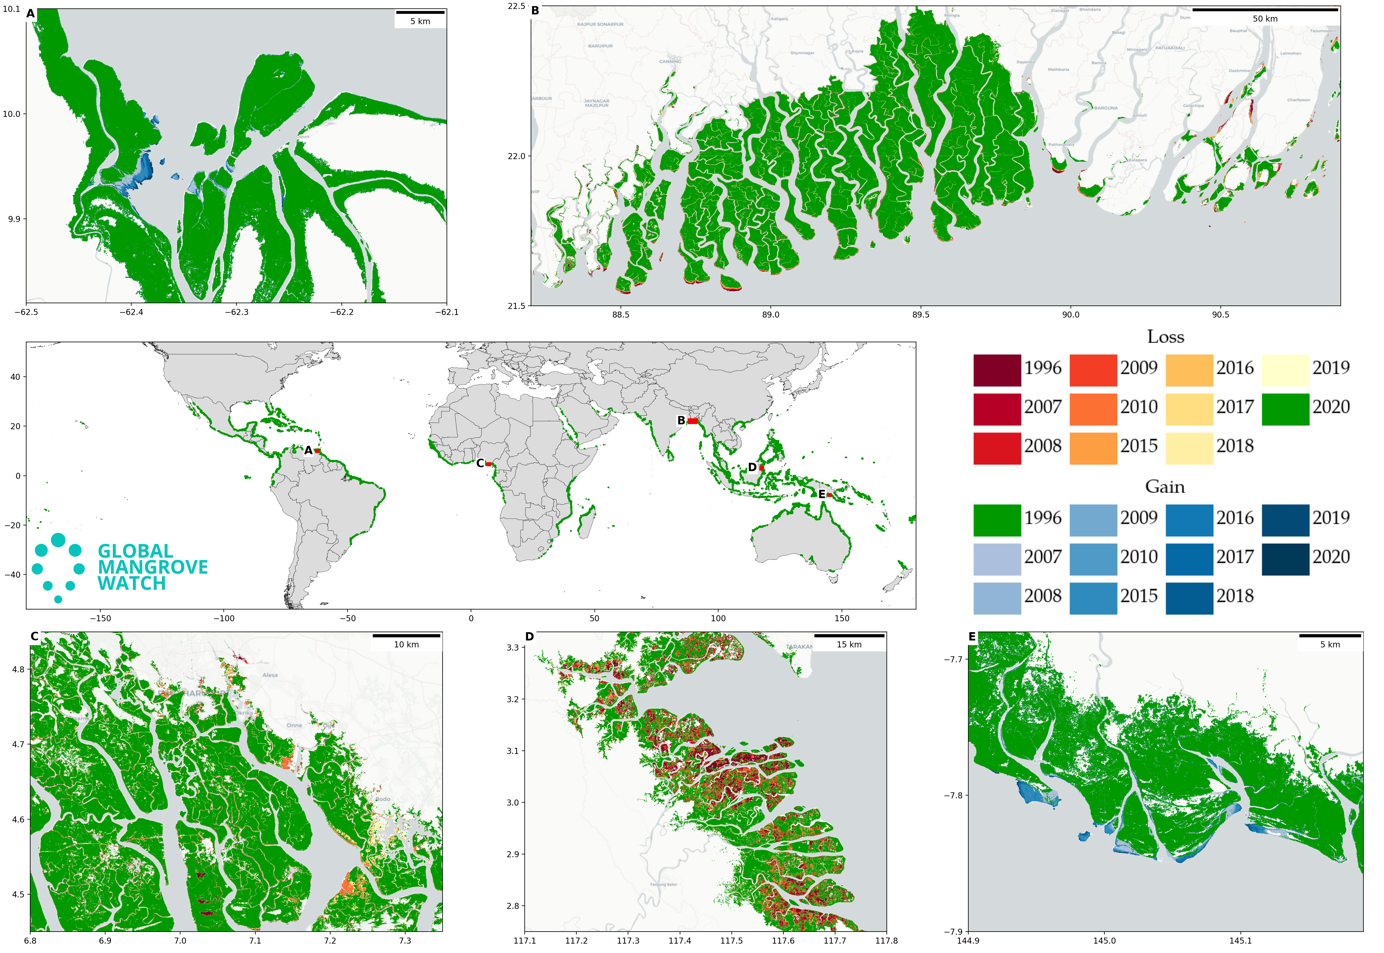
The mangrove maps were derived in two steps:

  • Generation of a baseline map of global mangrove extent for the year 2010, and,
  • Detection of changes between the 2010 baseline and each of the other years, respectively.
The 2010 baseline map was derived through two mapping efforts (Bunting et al., 2018 Bunting et al., 2022a) where an initial a 2010 baseline was derived using a Random Forest classification of a combination of radar and optical satellite data. The classification was confined within a mangrove habitat mask, which defines regions where mangrove ecosystems might be expected to exist. The mangrove habitat definition was based on geographical parameters such as latitude, elevation and distance from ocean water. Training for the habitat mask and classification of the 2010 mangrove mask was based on randomly sampling some 38 million points using historical mangrove maps (for the year 2000) of Giri et al. (2011) and Spalding et al. (2010) and the water occurrence dataset by Pekel et al. (2017). This baseline was updated subsequently, following user feedback, using over 11,000 Sentinel-2 scenes and an updated mangrove habitat mask using the XGBoost classifier (Bunting et al., 2022a). ALOS PALSAR data were used to perform a change detection to update the 2010 mangrove extent, with this forming the GMW version 2.5 product.

The classification accuracy of the 2010 v2.5 baseline dataset was assessed across 60 sites with 50,750 individual accuracy points. The overall accuracy was estimated as 95.1% (95th confidence interval of 93.8 – 96.5 %), an increase of 12.5 % over the original v2 GMW 2010 baseline (Bunting et al., 2018).

The maps for years other than 2010 were initially generated by detecting changes (gains and loss) from the 2010 baseline using JERS-1 SAR (1996), ALOS PALSAR (2007, 2008, 2009) and ALOS-2 PALSAR-2 (2015 – 2020) data (Bunting et al., 2022b). The analysis was then repeated using each subsequent year as the baseline, thereby producing 10 mangrove extent maps for each year. The final annual maps were then obtained through majority filtering where more than five extent maps needed to have identified a pixel as mangroves. These layers were then quality assured through manual interpretation to produce the final version 3.0 GMW products.

Uncertainty and Accuracy

Classification accuracies for the changes were assessed with over 38 sites, using a total of 17,366 reference points (Bunting et al., 2022b). The accuracy of mangrove pixels where no changes occurred was 87.4 % whilst, due to spatial mis-registration in the L-band SAR data (now resolved by JAXA for the 2023 v4.0 products), the change accuracies were lower, with changes from mangrove to non-mangrove having an accuracy of 60.6 % and non-mangrove to mangrove pixels being 58.1 %.

Support on data usage is available to potential users.
Bunting et al., 2022

Technical Characteristics

Spatial resolution: 25m

Geographical coverage: Global (all countries with mangroves)

Temporal coverage:
1996, 2007, 2008, 2009, 2010 (baseline year).
Annual data 2015-2020.

Update frequency: Annual from 2021. Next release scheduled for mid-2023.

Format: GIS shapefile (.shp), geocoded raster (Geotiff), numerical statistics (.xslx)

Data Policy: Public open (Creative Commons CC BY 4.0)


Associated Guidance and User Manual

Global Mangrove Watch Platform: www.globalmangrovewatch.org

Web address for dataset download:
UNEP-WCMC (vector data)
JAXA (raster data from Q4/2021)
Zenodo Data Repository (all v3.0 datasets)


Points of contact for queries

Dr. Ake Rosenqvist
GMW and K&C Science Coordinator
solo Earth Observation (soloEO)
Tokyo 104-0054, Japan
Email: ake.rosenqvist@soloEO.com

Dr. Pete Bunting
GMW technical lead
Institute of Geography and Earth Sciences
Aberystwyth University
SY23 3DB Wales, UK
Email: pfb@aber.ac.uk

Prof. Richard Lucas
GMW scientific lead
Institute of Geography and Earth Sciences
Aberystwyth University
SY23 3DB Wales, UK
Email: richard.lucas@aber.ac.uk