The Global Land Analysis and Discovery (GLAD) laboratory of the University of Maryland, under the lead of Professor Matt Hansen, has created the first global map of tree canopy cover. This map monitors change in the canopy cover gradually over time by using an algorithm to distinguish these changes through satellite images. It covers the loss and gain of forest mass from 2000 and is updated yearly. We present three case studies in which three countries use the global tree cover map to demonstrate how Earth observations and global datasets are used by countries for monitoring and reporting purposes.
Background
The definitions used for this product are: trees are vegetation taller than five meters in height; forest loss is the disturbance or change in a Landsat time series analysis from 2000-2019, and forest cover gain is the change from non-forest to forest from 2000 - 2012. (
Hansen et al, 2016). This map has enhanced the ability to understand human-induced and naturally occurring forest changes. This data supports the analysis of forest loss's local and global implications on social, environmental, and economic systems. Forest cover gains or losses signal many important aspects of an ecosystem, including climate regulation and carbon storage. Until this map was published, there was no way to get detailed and accurate satellite-based and readily available data from a local scale to a global scale. The map is based on Landsat data (30-meter resolution scale). This map reveals trends that can guide future efforts to preserve the forest. This map monitors change in the canopy cover gradually over time by using an algorithm to distinguish these changes through satellite images.
Since the first global map of forest cover was published by the University of Maryland, tropical countries working on the generation of activity data or the loss of forest area for reporting to REDD+ have used this global within their monitoring systems. Some countries used it to complement their data and others used it to improve their mapping methodology with new algorithms.
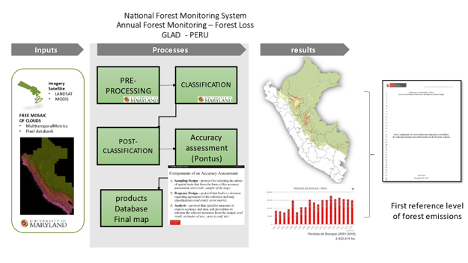
Peru Case Study
The National Forest Monitoring System in Peru initially used the information provided by the Global Land Analysis and Discovery (GLAD) laboratory of the University of Maryland, specifically for the pre-processing and coverage classification stages. During these two stages, there was a strengthening of capacities by GLAD researchers for specialists in Peru. The University of Maryland, with support from the US SilvaCarbon program, trained technical staff from Peru's Ministry of Environment (MINAM) to use their algorithm and generate tree cover loss metrics. The next step was the Post Classification Stage. This stage was carried out entirely in Peru with the participation of several Institutions such as OTCA, SERFOR, and MINAM, among others. Likewise, these same institutions were part of the processes for both the evaluation of uncertainty and the quantification of the final maps. Finally, MINAM and SERFOR developed the first Reference Level of Forest Emissions using the GLAD methodology in Peru.
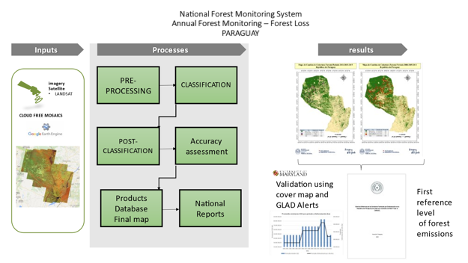
Paraguay Case Study
Initially, the National Forest Monitoring System in Paraguay used global data sources on land cover and land use as background information on deforestation in Paraguay, highlighting the map by Hansen et al. (2013). Finally, within the framework of the REDD+ preparatory phase, following the workflow of the image, it was possible to generate the first national map of forest cover loss over 15 years, which was used as the basis for preparing the Report on Forest Coverage Levels. Forest Emissions Reference. The main benefit of having global data is the possibility of validating the results obtained nationally. Also, global data such as GLAD Alerts (University of Maryland/Global Forest Watch) are currently used to complement the national forest monitoring system.
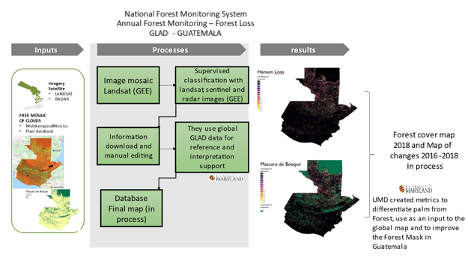
Guatemala Case Study
Currently, the National Institute of Forests (INAB) is updating Guatemala's 2018 forest cover map. The updated product will include changes from 2016 - 2018 using INAB's methodology and a palm forest mask derived from the University of Maryland GLAD algorithms. The integration of the forest data with the palm data and the new classification was done in Google Earth Engine. The data is downloaded for cleaning and manual editing. While editing the areas that represented a difficulty in the defined class, the information is corroborated with the GLAD global data to have a reference in the interpretation. In addition, the GLAD data is used to validate the forest class. This map is still in the process of manual editing.
Impact
Although the GLAD global product is not calibrated entirely with country-based data and sometimes does not represent the land classifications of each country, the algorithms used for the satellite image processing to detect the change in coverage facilitate the analysis of forest change monitoring. In these three cases, we see how the global forest cover map can be ingested into different stages in generating national data. Other countries with similar challenges can replicate these three examples.