Since 2014, the CEOS Volcano Pilot has used a range of satellite sensors to monitor volcanic activity across Latin America, from Mexico to the Southern Andes. The pilot has shown that satellite data can be a critical component to monitoring, especially at remote volcanoes where in-situ instruments are impractical. The pilot has further demonstrated that satellite monitoring can accurately detect deformation, even in quiescent volcanoes, which can be a precursor to renewed activity.
Reventador volcano, Ecuador, and Pacaya volcano, Guatemala
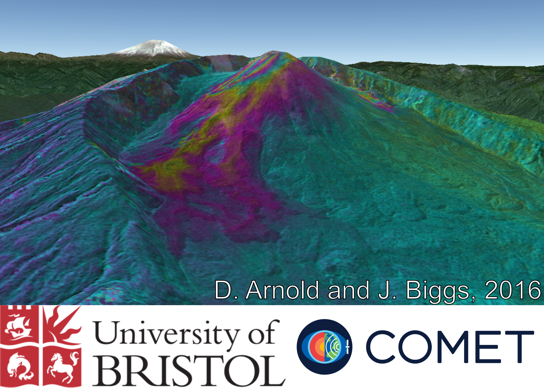
Topographic fringes from a TanDEM-X image pair, showing the thickness of recent lava flows at Volcán Reventador, Ecuador. One complete color cycle corresponds to 25 m of new lava. Images like these supplement limited ground based measurements and make it possible to see how the lava eruption rate is changing over time.
Following a large volcanic eruption in 2002, Reventador, Ecuador, has experienced several periods of eruption, and activity is still ongoing. The volcano is located in a remote part of the Ecuadorian rainforest, but can still have a significant impact on human population—ash fall from the 2002 eruption caused power outages and cancelled flights in the Ecuadorian capital, Quito, and pyroclastic flows and mudslides damaged a nearby road and oil pipeline. Reventador’s remote location makes it difficult to monitor with ground-based techniques, since maintaining instruments either requires good weather conditions for helicopter operations or a long trek through dense jungle. Earth observation satellites therefore provide an ideal technique for monitoring ongoing eruptive activity. Synthetic Aperture Radar (SAR) is especially valuable due to its ability to make observations through clouds and at night.
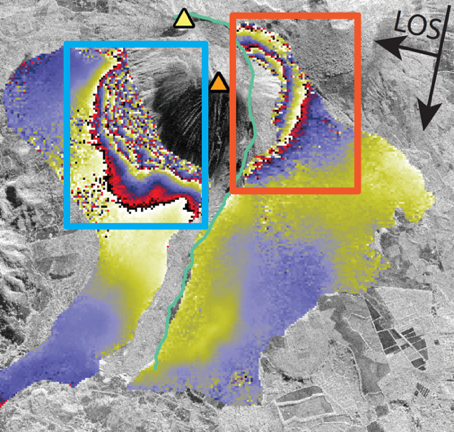
InSAR data spanning eruptions in January and March of 2014 show surface deformation due to magmatic activity and gravitational instability. A co-eruptive RADARSAT-2 interferogram shows significant motion along the unstable southwest sector of the edifice (Figure left). Each color fringe represents 2.8 cm of deformation. Fringes located in the blue box indicate motion away from the satellite, while red boxes indicate motion toward the satellite. This interferogram shows ~6 cm of deformation on the eastern portion of the edifice caused by the intrusion of a dike. Even greater displacements are observed on the southwest flank due to co-eruptive flank motion. Coherence loss is significant due to the magnitude of deformation, but other SAR data have measured ~83 cm of co-eruptive flank displacement.
As part of the volcano pilot, the University of Bristol has been using data from RADARSAT-2 and TanDEM-X to map the emplacement of lava flows that began as part of a phase of Reventador’s activity that began in 2012. Using the high-resolution SAR data provided by these satellites allows for precise estimation of the thickness of lava flow deposits, which reach up to 75 m in places. Looking at variations in the erupted lava volume over time provides an indication of how the eruption rate changes as activity progresses. RADARSAT-2 interferograms have been used to monitor ground deformation at Reventador, and have documented subsidence due to cooling of recent lava flows. No deformation associated with magma intrusion has been recognized; such signals would indicate an increase in magma supply to the volcano, which could mean an increase in the hazard posed to nearby infrastructure.
Pacaya is part of a volcanic complex located 30 km south of Guatemala City. Following over 100 years of quiescence, Pacaya entered a phase of continuous activity beginning in 1962, with eruptions prompting 14 evacuations over the past 30 years. The volcano poses a major hazard to nearby inhabitants due to a significant gravitational instability of its southwest flank. The ancestral Pacaya edifice collapsed sometime between 600 and 1600 years ago, creating a collapse caldera of ~10 km2. The edifice has since rebuilt itself, and currently sits on a mechanically weak layer of material left over from the ancestral collapse. Motion of the unstable southwest flank has been observed during eruptions in 2010 and 2014.