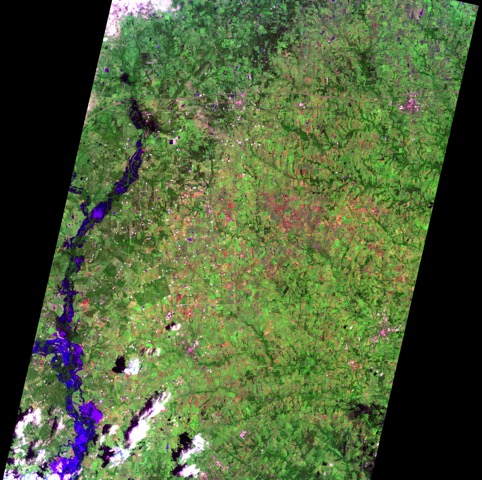
EO-1 image showing the flooding along Peach Creek in Texas at 1045 Central Daylight Time on 27 May 2015. Courtesy of NASA.
Texas and Oklahoma experienced their wettest month on record in May 2015, turning a long-term drought into a severe flood event. Numerous streams reached record levels and at least 31 people were killed; property damage amounted to $45 million for public property and millions more for private property.
Although not a formal Flood Pilot site, the Flood Pilot responded by requesting and making available high-resolution satellite imagery showing the areas covered by the flooding in Texas. These included:
- High-resolution (10 to 30 meters) visible-wavelength imagery from the Advanced Land Imager (ALI) onboard the NASA EO (Earth-Observing)-1 satellite (Figure 1);
- High-resolution (15-meter) visible-wavelength optical imagery from the NASA ASTER (Advanced Spaceborne Thermal Emission and Reflection Radiometer) onboard the Terra satellite;
- Synthetic Aperture Radar (SAR) images (1-100 meters resolution, depending on the scan mode) from the Italian Space Agency (ASI) COSMO (Constellation of small Satellites for the Mediterranean basin Observation)-SkyMed satellites (Figure 2). Unlike visible-wavelength images, SAR can see through clouds, which is highly valuable since flooded areas are often cloud-covered.
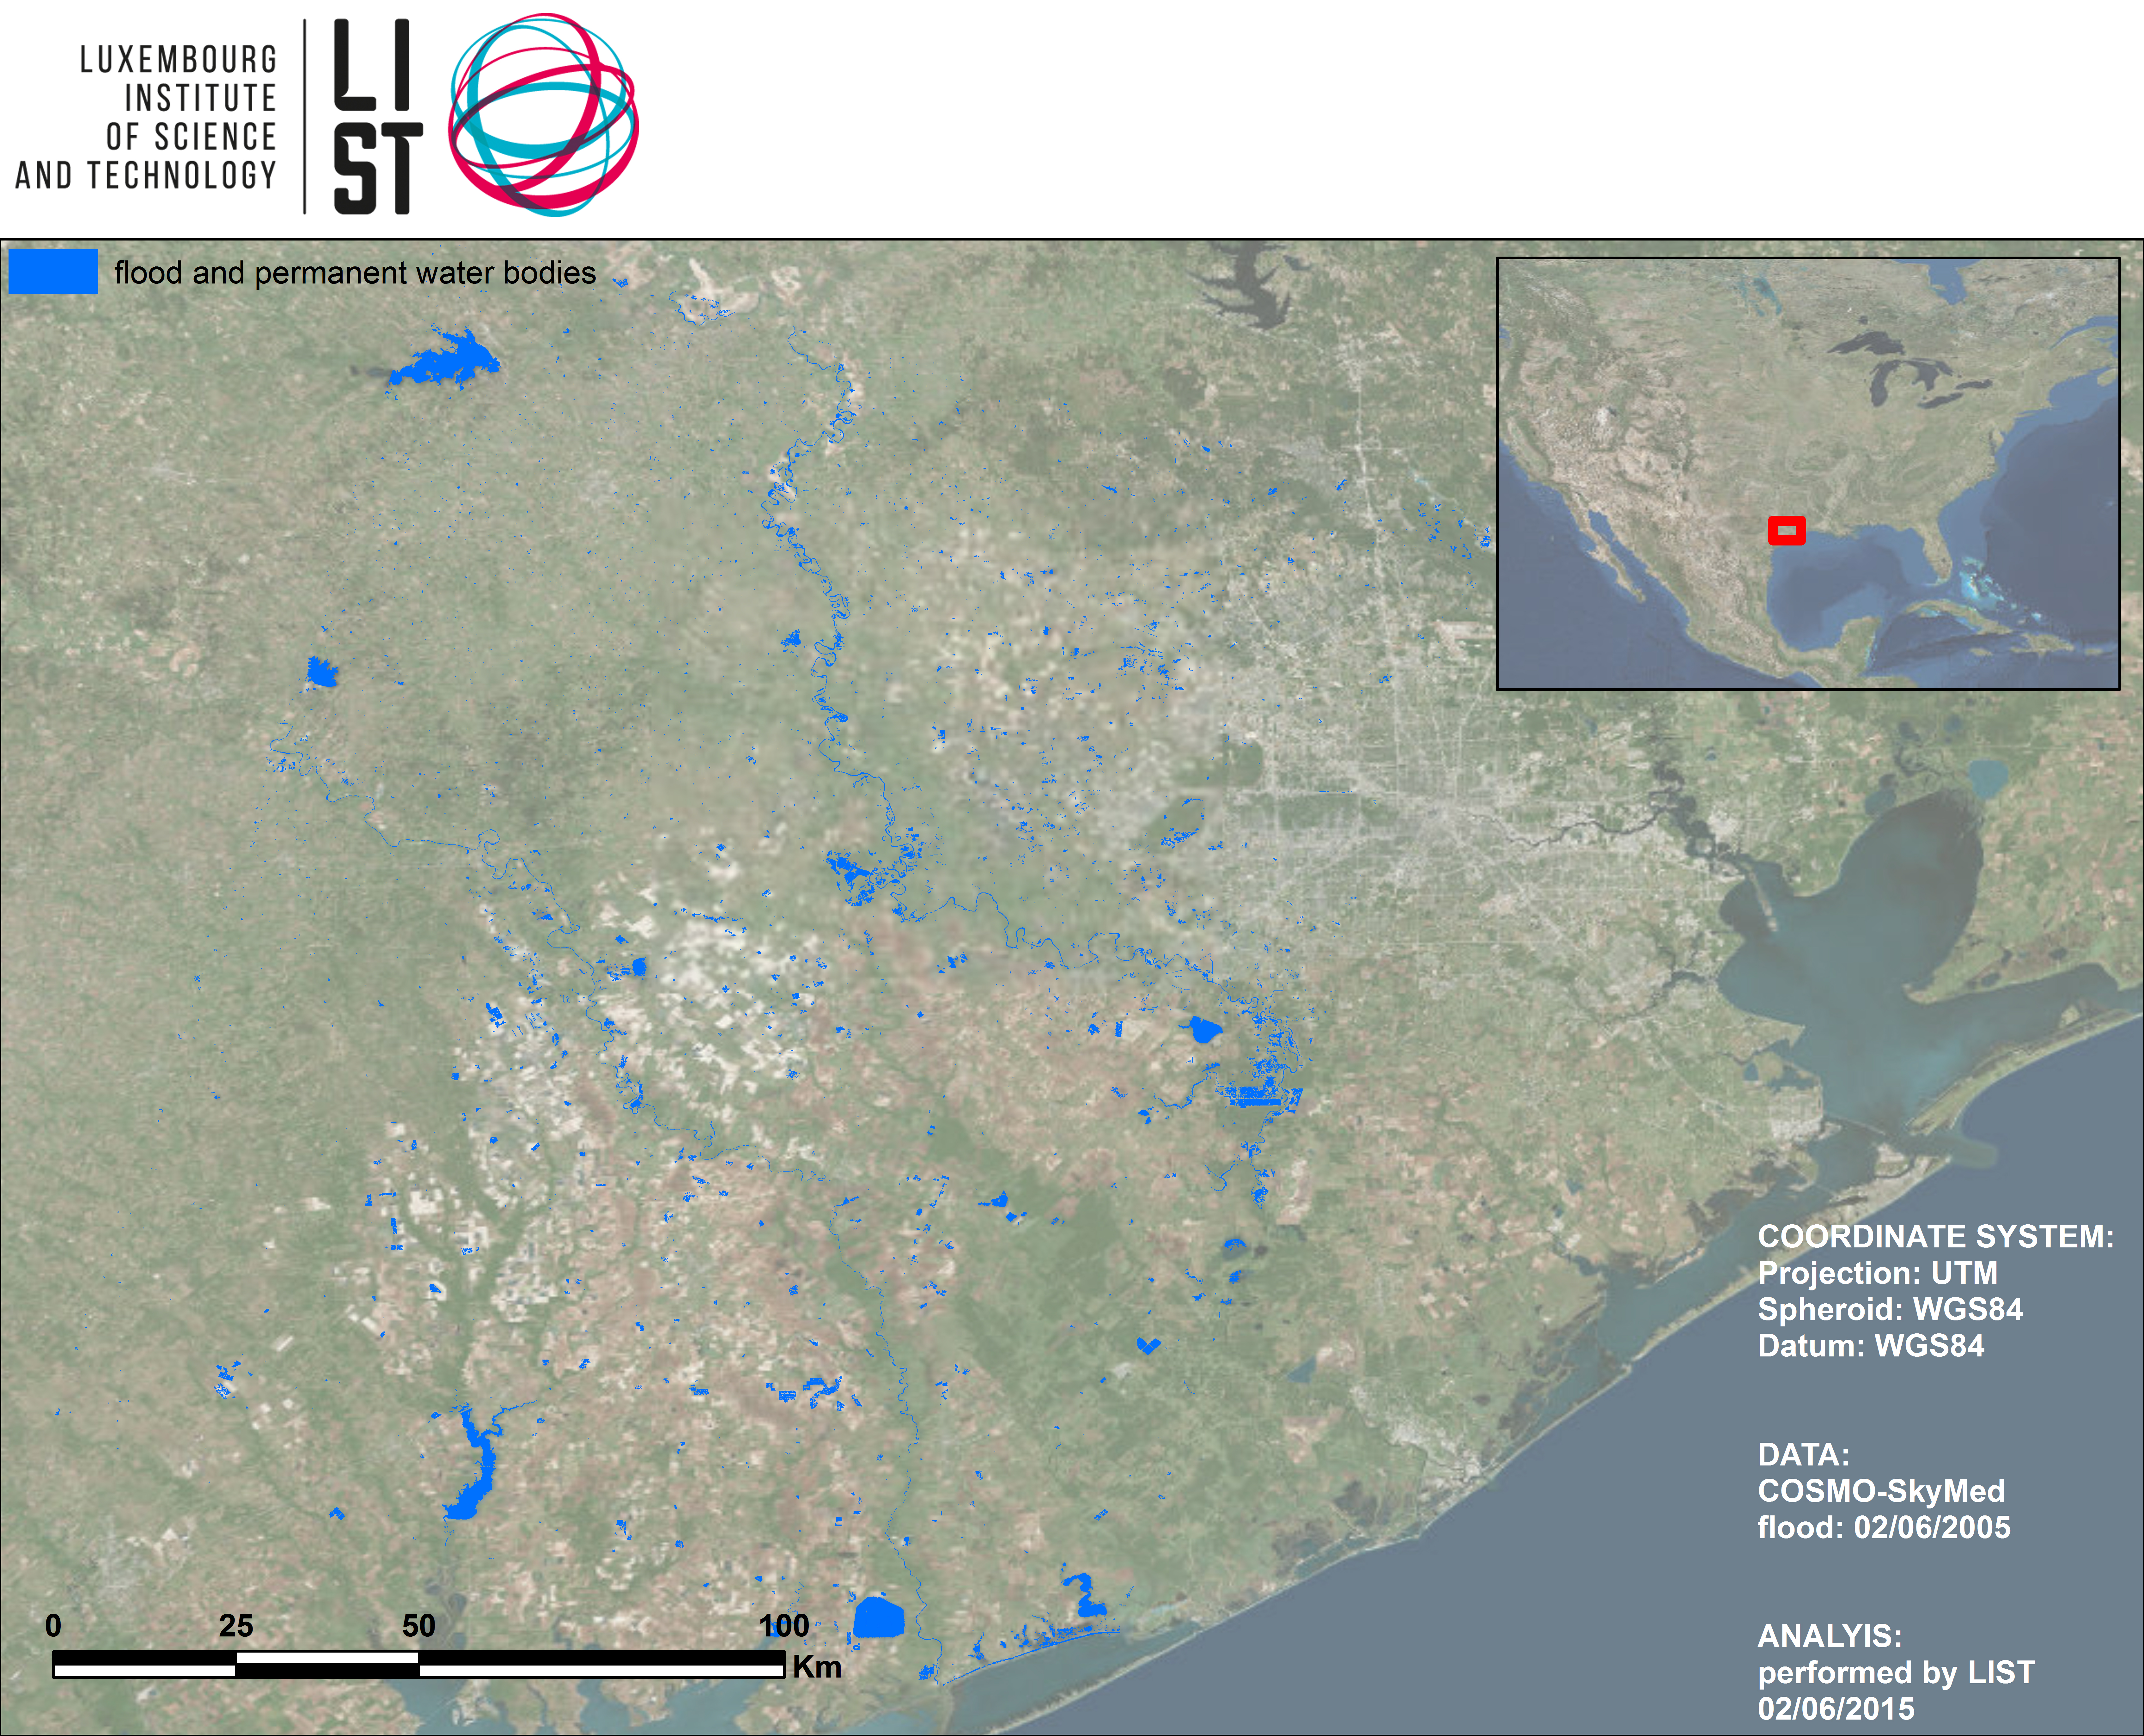
COSMO-SkyMed image of the flood regions and other water bodies (blue) on 2 June 2015, analyzed by the Luxembourg Institute of Science and Technology in support of the Flood Pilot.
In addition, the Global Flood Monitoring System (GFMS) of the University of Maryland provided real-time flood forecasts (Figure 3) to supplement to forecasts produced by the US National Weather Service.
These data were made available to those responsible for flood response, including:
- US Federal agencies: the Federal Emergency Management Agency (FEMA), Forest Service, and Environmental Protection Agency (EPA);
- State of Texas agencies: the Water Development Board and the Commission on Environmental Quality; and
- The University of Texas at Austin, who provided imagery to the Texas Emergency Operations Center and the Governor’s Emergency Management Council to coordinate responses to the flooding.
Theresa Howard and Gordon Wells of the University of Texas at Austin stated that “The imagery offered a detailed view of inundation impacting agriculture in rural areas, which is information that can be difficult to obtain from other sources. The imagery also helps to fill in the coverage gaps between stream gages that are monitored for current and forecast conditions.” This in turn helped them to coordinate aerial photographic surveys to fill in the gaps between the satellite data collections, and to best prioritize how available resources would be deployed. They also noted that these data gave a better picture than simple flood crest information because “The greatest impacts do not necessarily coincide with the locations of the highest measured flood crests, but occur at sites that contain vulnerable features.”

Inundation forecast at 1-km resolution for southeastern Texas valid 1800 UTC 28 May 2015 produced by the Global Flood Monitoring System of the University of Maryland in support of the Flood Pilot.