Jupyter Notebooks for Capacity Development Webinar

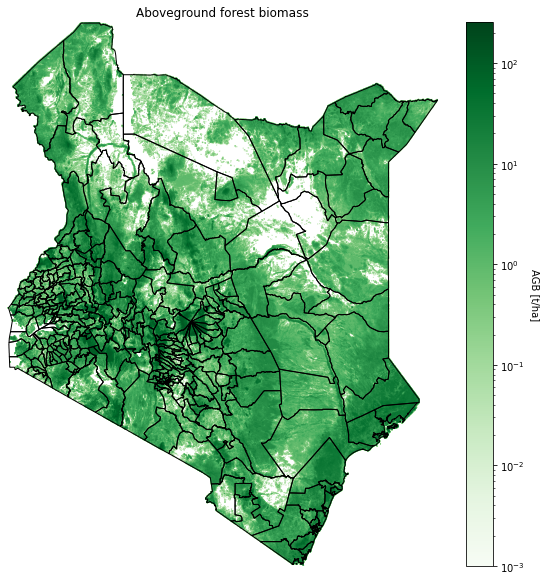
This image is above-ground biomass in Kenya in tonnes per hectare. The data is on the CEDA archive (described here: https://catalogue.ceda.ac.uk/uuid/653fdd814dba4103a301221955781e35). The Jupyter notebook reads data directly from the archive and reprojects the tiff file, overlaying it with a shapefile containing Kenyan administrative regions to produce this image. This process makes it possible to extract key statistics on levels of above-ground woody biomass for variousregions and provide reports to key government departments in Kenya.
Webinar Recording
Webinar Feedback Survey
A big thank you to all our webinar participants. To assess the quality and impact of your webinar experience and make future webinars even better, please fill out our quick Webinar Feedback Survey to let us know how we did.
Overview
The CEOS Working Group on Capacity Building and Data Democracy and the Working Group on Information Systems and Services ran a joint webinar on Jupyter Notebooks for Capacity Development. The aim of this webinar was to introduce space agencies and environmental organisations worldwide to Jupyter Notebooks and take a tour of emerging services from CEOS Agencies and their applications. We illustrated how Jupyter Notebooks can be used to support capacity development and the exploitation of Earth Observation data by a broad range of users. There were two sessions via zoom to allow for global attendance.
Take a look at the agenda description below. Links to presentations from the webinar are available at the bottom of this page.
Agenda
Jupyter Notebook Definition and Potential Support for Capacity Development
During this session:
- Overview of what a Jupyter Notebook is and the benefits of using one
- Demo a simple example of plotting sea surface temperature data, navigating an archive, and adjusting the colour scale
- Describe open-source Jupyter Notebook resources and different platform and environment types
- Discuss how collaborative research and activities such as international Hackathons can also be supported
Jupyter Hub and Notebooks on Data Analysis Platforms
During this session, we looked at two examples from the UK’s JASMIN Jupyter Notebook service, which can access over 20 petabytes of data on the CEDA archive. We then explored the Sentinel 5p global archive of data and demonstrated how to use a very basic Notebook to use the data and answer valuable questions, e.g. how did pollution levels change in large cities during the Covid-19 pandemic? We also looked at a smaller scale specialist example, regional NCEO biomass maps. This session helped to demonstrate how, in addition to helping users use Jupyter Notebooks to obtain domain-specific information from data, we can also help them learn technical knowledge and skills related to libraries, modules, and shape files.
Open Data Cube and Google Earth Engine – A Jupyter Notebook Sandbox Demonstration
The Open Data Cube (ODC) Google Sandbox is a free and open programming interface that connects users to Google Earth Engine datasets. This open-source tool allows users to run Python application algorithms using Google’s Colab Notebook environment. This demonstration showed two examples of Landsat applications focused on scene-based cloud statistics and historic water extent. Basic operation of the tool will support unlimited users for small-scale analyses and training but can also be scaled in size and scope with Google Cloud resources to support enhanced user needs.
ESA PGDS Data Cube and Time Series Data
The ESA PDGS Data Cube is a pixel-based access service that enables human and machine-to-machine interfaces for Heritage Missions (HM), Third-Party Missions (TPM) and Earth Explorer (EE) datasets. The pixel-based access service provides the users with advanced retrieval capabilities, such as time series extraction, data subsetting, mosaicking, band combinations, and index generation (e.g. NDVI, anomalies, and more) directly from the EO-SIP packages with no need for data duplication or data preparation.
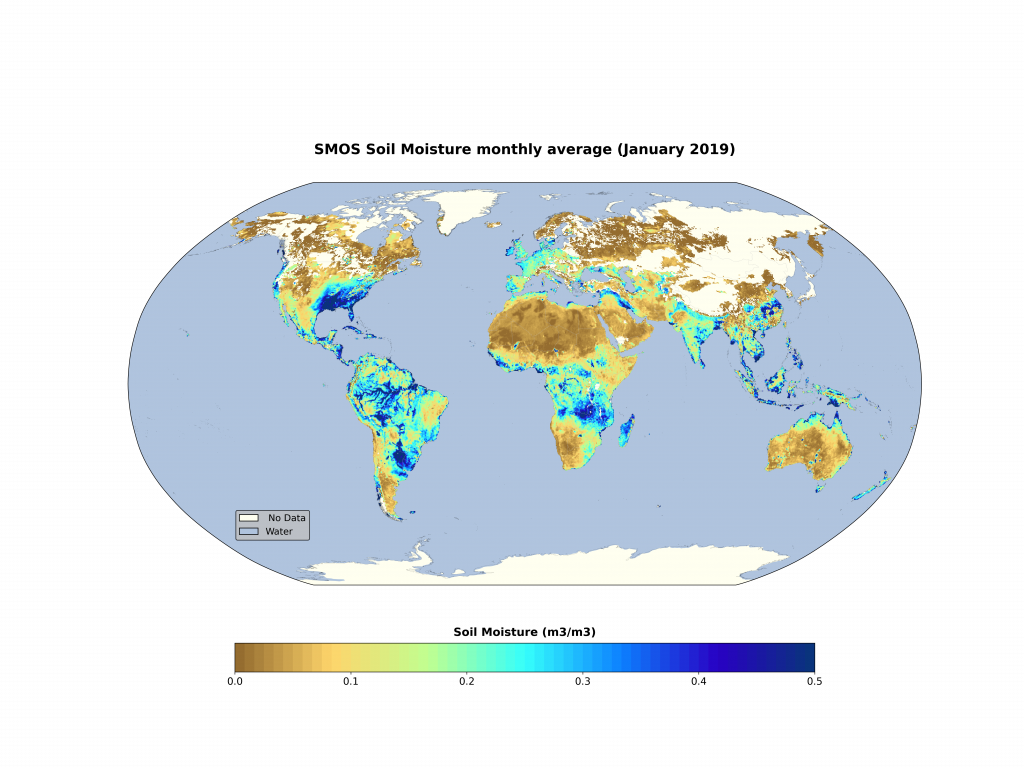
In addition to the web-based Explorer graphic user interface, the ESA PDGS Data Cube service also provides a Jupyter processing environment to allow users to import, write, and execute code that runs close to the data. This demonstration showcased how to retrieve Soil Moisture time-series using the Jupyter environment in order to generate thematic maps (monthly anomalies map) over an area of interest. The benefit of using the pixel-based service with respect to traditional access services in term of resources usage will be also highlighted.
Earth Analytics and Interoperability Lab – Big Data Processing
The CEOS Earth Analytics Interoperability Lab (EAIL) is a platform for CEOS projects to test interoperability in a live Earth Observation (EO) ecosystem. EAIL is hosted on Amazon Web Services and includes facilities for Jupyter Notebooks, scalable compute infrastructure for integrated analysis, and data pipelines that can connect to new and existing CEOS data discovery and access services. This demonstration showed how we use Jupyter Notebooks with the Python Dask Library to efficiently compute and perform large-scale analyses (10s GB) with interactive plotting and scalable compute resources in EAIL.
Capacity Development Panel and Discussion
Kenton Ross from NASA’s Capacity Building and Applied Sciences Program led discussions with a panel of international experts. We explored the needs of EO data users worldwide and how CEOS Agencies can support them.
- Wednesday, July 21st, 2021 | 14:00 – 16:20 UTC | Panelists: Edward Boamah (Digital Earth Africa), Hayley Evers-King (EUMETSAT), Sean McCartney (NASA DEVELOP)
- Thursday, July 22nd, 2021 | 02:00 – 04:20 UTC | Panelists: Edward Boamah (Digital Earth Africa), Franz Meyer (University of Alaska Fairbanks)
Speakers: Kenton Ross (NASA), Yousuke Ikehata (JAXA), Esther Conway (NCEO/UKSA), Brian Killough (SEO/NASA), Giuseppe Troina (ESA), Matt Paget (CSIRO)
Webinar Presentations & Files Available for Download
- WGISS Overview – Yousuke Ikehata
- Jupyter Notebooks for Capacity Development Overview – Esther Conway NCEO-UKSA
- Jupyter Notebooks on Data Analysis Platforms – Esther Conway NCEO-UKSA
- JASMIN Jupyter Notebooks
- Open Data Cube Sandbox – Brian Killough CEOS SEO
- Open Data Cube Sandbox Notebooks
- ESA PGDS Data Cube and Time Series Data – Simone Mantovani MEEO
- Earth Analytics Interoperability Lab, Big Data Processing – Matt Paget CSIRO
For questions, please Contact Us.

An example from the ESA PDGS Data Cube service of one possible Jupyter Notebook output, to be showcased during the webinar.