Summary of Seismic Hazards Pilot and Demonstrator Activities (2014–2022):
The Seismic Hazards initiative, rooted in global geohazards priorities, launched its Pilot activity in 2014 to support seismic hazard analysis through satellite Earth Observation (EO). The Pilot achieved three primary objectives: generating global strain rate and active fault maps using InSAR and optical data, supporting Geohazard Supersites (GSNL) for focused observations, and developing rapid-response products for moderate to major earthquakes (M>5.8). It produced terrain motion maps, ground deformation models, and seismic source parameters for events like Nepal (2015), Italy (2016), and Ecuador (2016), aiding civil protection efforts and advancing seismic hazard science. EO data were validated using GNSS measurements and complemented by mapping active faults in regions such as Myanmar and Chile.
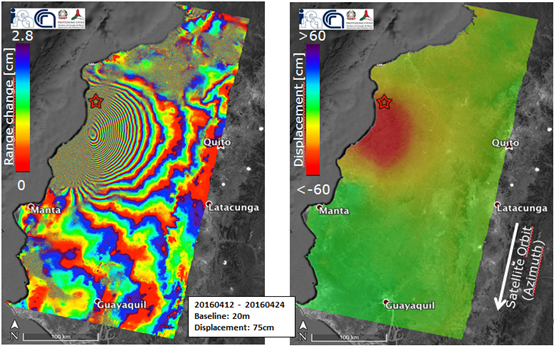
Figure 1: Interferogram generated by CNR-IREA for the 2016 Ecuador earthquake, exploiting two Copernicus Sentinel-1 images acquired before and after the event, respectively
The Geohazards Exploitation Platform (GEP) emerged as a vital tool during the Pilot, enabling access to EO data archives, processing tools, and collaborative environments for geohazard assessment. The platform facilitated rapid product generation, showcased innovative processing capabilities, and expanded its user base to other geohazard initiatives.
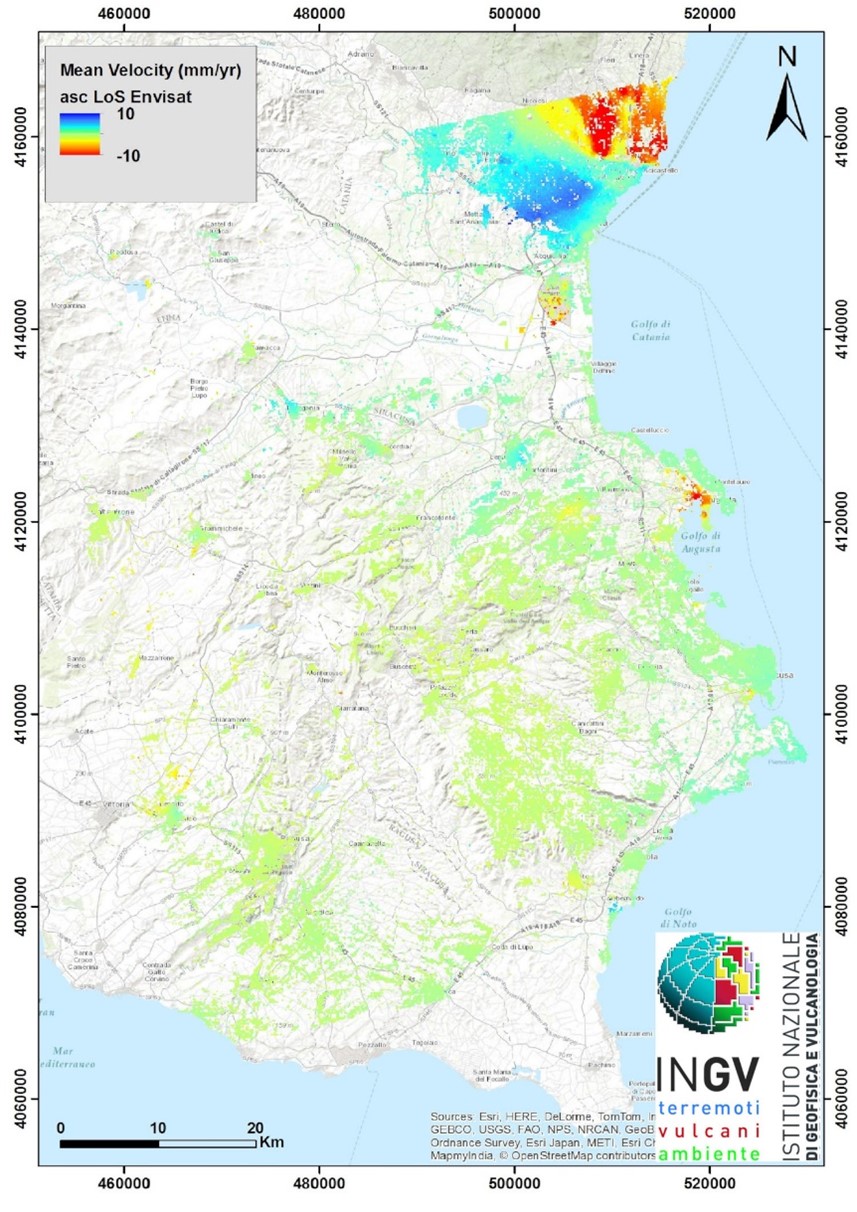
Figure 2: SBAS processing result on the GEP: image shows the mean ground velocity for SE Sicily region, containing Envisat ASAR data (2003-2010), processed by INGV.
Building on the Pilot’s success, the Demonstrator activity began in 2018 to expand from regional to global coverage, support more earthquake responses, and foster local capacity building. The Demonstrator broadened its user base, promoted EO adoption among decision-makers, and developed consensus methodologies for data use. It also highlighted the demand for Very High Resolution (VHR) imagery for fault mapping, leading to a proposed second phase of the Demonstrator. Notable outputs include detailed co-seismic deformation maps for events like the Tirnavos (Greece) earthquake in 2021, illustrating the societal and scientific value of EO technologies.
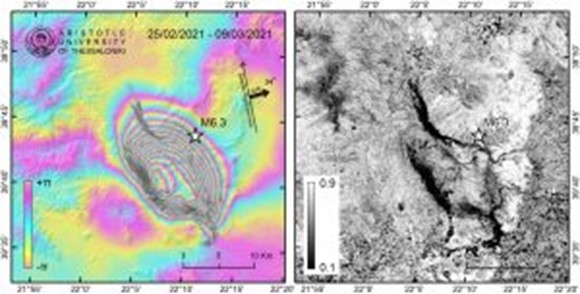
Figure 3: Figure 9. Example of co-seismic differential interferogram (left image) and interferometric coherence map (right image) of the M6.3 earthquake in Tirnavos (Greece), using Copernicus Sentinel-1 pre-event (25/02/2021) and post-event (09/03/2021) data. Wide-spread liquefactions along river basins and distributed surface deformation are depicted by patterns of low coherence (areas in black) nearby the epicentral area. Contains modified Copernicus Sentinel data (2021), processed online on the Geohazards Exploitation Platform (GEP) by Aristotle University of Thessaloniki (AUTh).
Seismic Risks initiative (2024-2027):
The main goal of EO for Seismic Risks is to provide new and existing users with a mechanism to access satellite EO data (e.g. based on yearly quota as typically done through CEOS activities), for which they can use to better their research or perform activities that would not be possible with only free and open data. The Initiative follows the Seismic Hazards Pilot (April 2014 – November 2017) and the Seismic Hazards Demonstrator (May 2018 – October 2022.) The EO for Seismic Risks Initiative aims to continue pursuing the successful activities of the precursor Seismic Hazards Pilot and Demonstrator activities (see lessons learned), while also engaging with new user communities from the civil engineering community, concerning seismic exposure in urban land (buildings and infrastructures). The initiative has officially begun at the beginning of 2025.
This new initiative will reactivate a sub-set of the previous Seismic Hazards Demonstrator, focusing on the following modified objectives of the previous activities:
- Develop and demonstrate advanced science products for earthquake response [Observation of earthquakes with M>5.5], and the scientific investigation of earthquake sources. This objective includes generating systematic deformation maps using Optical and Radar (InSAR) triggered by the USGS pager alert system using EO response services.
- Support the mapping of active faults and their surroundings by providing EO InSAR and Optical data as well as processing capabilities to existing initiatives.
- Support seismic exposure mapping in cities exposed to seismic risk by providing satellite EO data including VHR Optical and stereo optical data, as well as processing capacities. The data shall be both systematically acquired archive datasets as well as crisis images if an event occurs.
- Articulate relationship with the International Charter and the Copernicus EMS; explain and promote EO capabilities for damage mapping in the disaster response phase. Increase collaborative activity with the International Charter, taking advantage of established data sharing agreements and observer status. the operational guidelines for earthquake response within the International Charter make it possible to provide science products (e.g. deformation maps) to complement damage mapping; this allows for the acquisition of complex data from SAR missions other than Sentinel-1 (e.g SAOCOM SLC Stripmap).
The main idea of the new SD is to address seismic risk, not only hazard, focusing in and around urban land, adding a new EO activity to support seismic engineers:
- Seismic exposure and vulnerability mapping: characterize buildings and infrastructure using satellite EO (with at least 4-6 scenes per year). VHR Optical data can be used to identify footprints and quantify volume/height of buildings. Having multiyear data over time can allow for tracking changes in exposure in terms of new buildings, demolished buildings, etc. Over a longer period, these data can be processed with machine learning algorithms to help forecast exposure. This activity requires regular acquisitions (every 2-3 months) using VHR SAR and VHR Optical and for some EO missions it requires using the same sensor mode or geometry.
- To carry out the above mapping, we will generate a list of areas prone to seismic risk that are lacking background coverage (VHR Optical and Radar) and the CEOS member Agencies will be asked to plan and provide datasets over such strategic areas. This will be done in collaboration with the seismic engineering community, using global seismic risk maps such as via the Global Earthquake Model (GEM) portal (https://maps.openquake.org/map/grm-2023-1).
- These datasets could also be used in the event of an earthquake occurring near one of the sites, as archive data is on hand from the previous acquisitions and post-event data is already being tasked.
This Initiative will mainly focus on the region of Latin America and the Caribbean. It can be seen in Figures 5 and 6 above that nearly all of Central America is covered by the global tectonic mask, in addition to a large portion of Western South America, including Chile, Argentina, Peru, Colombia, Ecuador, and Bolivia. Organizations who will be partnering with ESA and INGV on this initiative are GEM: The Global Earthquake Model, EUCENTRE, COMET, LIST, and the Aristotle University of Thessaloniki.
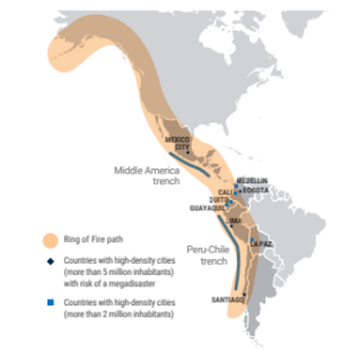
Figure 4: Main seismogenic zones in Latin America according to the report of UNOCHA on Natural Disasters in the LAC region (2000-2019).
The urban areas which have been selected for background missions are listed below:
- Meico City
- Guatemala City
- San Salvador
- Managua
- San Jose
- Panama City
- Bogata
- Quito
- Lima
Contacts:
Philippe Bally (ESA), philippe.bally@esa.int
Stefano Salvi (INGV), stefano.salvi@ingv.it
Zachary Foltz (ACRI-ST c/ESA), zachary.foltz@acri-st.fr